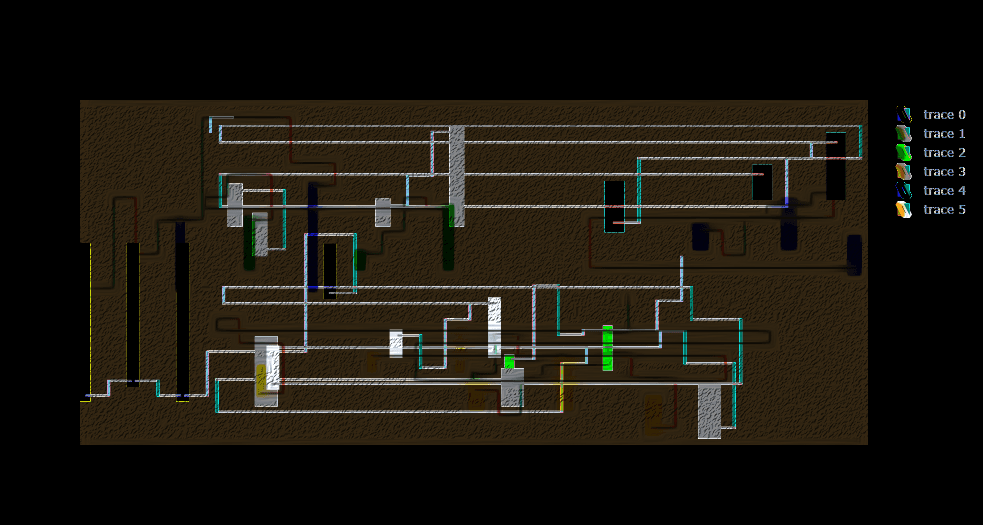
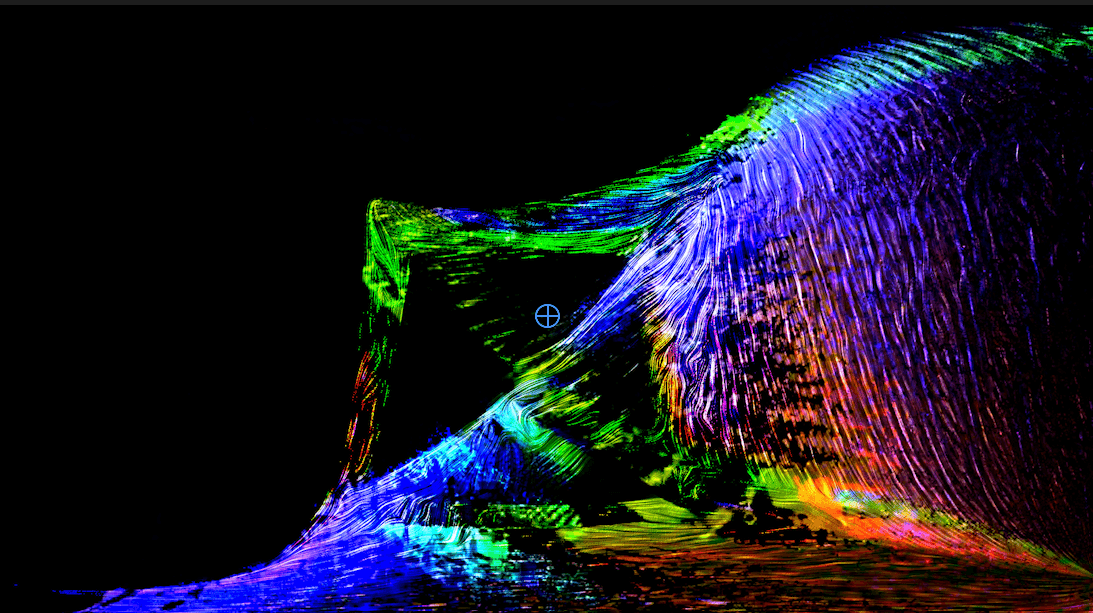
TunnelScapes
For this week's Creative Code challenge by @sableRaph: “Waterfall”, TunnelScapes takes a Python coded waterfall graph example by Plotly: https://plotly.com/python/waterfall-charts/ and expands it to speculatively design various TunnelScapes.
Poetry
Inspecting new TunnelScapes
The Excavation of this new Area
Seeking what are the new criterias
For New tunnels to be added
New sections to be the padded
The Necessary Points
For the Mapping these TunnelScapes Joints
That make for various escapes
Images


Python Code
#PLotly Example remix by me

#Building out the following : https://plotly.com/python/waterfall-charts/

#Added extra line and found a near glitch effect by playing with base

import plotly.graph_objects as go
import random as rd

def waterfall2(a,z):

    transactions = rd.sample(range(-10, 10), 10)  #random list of 10

    fig = go.Figure()

    fig.add_trace(go.Waterfall(
        x = [["2020", "2021", "2021", "2021", "2021", "3018", "2022", "2022", "2022"],
            ["initial", "firstRace", "secondRace", "ThirdRace", "Average", "firstRace", "secondRace", "thirdRace","Average"]],
        measure = ["absolute", "relative", "total", "relative", "total", "relative", "relative", "relative", "total"],
        y = transactions[:9], #count  from start,
        base = a + 4,
         totals = {"marker":{"color":"deep sky blue", "line":{"color":"blue", "width":z}}}
    ))

    fig.add_trace(go.Waterfall(
        x = [["3016", "3017", "3017", "3017", "3017", "3018", "3018", "3018", "3018"],
              ["initial", "firstRace", "secondRace", "ThirdRace", "Average", "firstRace", "secondRace", "thirdRace","Average"]],
        measure = ["absolute", "relative", "relative", "total", "relative", "relative", "absolute", "relative", "total"],
        y = [1, 2, 3, -1, None, 1, 2, -4, None],
        base = a + 6,
         totals = {"marker":{"color":"yellow", "line":{"color":"deep sky blue", "width":z+2}}}
    ))

    fig.add_trace(go.Waterfall(
        x = [["2516", "2517", "2517", "2517", "2517", "2518", "2518", "2518", "2518"],
             ["initial", "firstRace", "secondRace", "ThirdRace", "Average", "firstRace", "secondRace", "thirdRace","Average"]],
        measure = ["absolute", "relative", "relative", "relative", "total", "relative", "relative", "total", "total"],
        y = [0.5,z/2,z/-3,3/z,1,2,3], #shuffle from end,
        base = a - 4,
        totals = {"marker":{"color":"black", "line":{"color":"green", "width":z-3}}}
    ))

    fig.add_trace(go.Waterfall(
        x = [["2516", "3018", "2517", "2517", "3018", "2518", "2518", "2518", "2518"],
            ["initial", "firstRace", "secondRace", "ThirdRace", "Average", "firstRace", "secondRace", "thirdRace","Average"]],
        measure = ["absolute", "relative", "relative", "relative", "total", "relative", "relative", "relative", "total"],
        y = [1.1, -2.2, 3.3, 1.1, 3, 1.1, -2.2, -4.4, None,5.5,-4.4,None,None,5],
        base = a - 6,
        totals = {"marker":{"color":"black", "line":{"color":"deep sky blue", "width":z*2}}}
    ))

    fig.add_trace(go.Waterfall(
        x = [["2016", "3018", "2017", "2017", "2017", "3018", "2018", "2517", "2517"],
             ["initial", "firstRace", "secondRace", "ThirdRace", "Average", "firstRace", "secondRace", "thirdRace","Average"]],
        measure = ["absolute", "relative", "relative", "relative", "total", "relative", "relative", "relative", "total"],
        y = [1.1, -2.2, 3.3, 1.1, 3, 1.1, -2.2, -4.4, None,5.5,-4.4,None,None,5],
        base = a + 8,
        totals = {"marker":{"color":"white", "line":{"color":"red", "width":z+7}}}
    ))

    fig.add_trace(go.Waterfall(
        x = [["3016", "3017", "3017", "3017", "3017", "3018", "2518", "2518", "3018"],
            ["initial", "firstRace", "secondRace", "ThirdRace", "Average", "firstRace", "secondRace", "thirdRace","Average"]],
        measure = ["absolute", "relative", "relative", "relative", "total", "relative", "relative", "relative", "total"],
        y = [1.1, -2.2, 3.3, 1.1, 3, 1.1, -2.2, -4.4, None,5.5,-4.4,None,None,5],
        base = a-3,
        totals = {"marker":{"color":"black", "line":{"color":"grey", "width":z}}}
    ))

    fig.update_layout(
        waterfallgroupgap = (z*z)/a,
    )

    fig.update_layout(xaxis=dict(visible=False), yaxis=dict(visible=False)) #removing axes

    fig.show()

waterfall2(1000,5)
waterfall2(950,7)
waterfall2(900,17)
waterfall2(850,10)
#PLotly Example remix by me

#Building out the following : https://plotly.com/python/waterfall-charts/

#Added extra line and found a near glitch effect by playing with base

import plotly.graph_objects as go
import random as rd

def waterfall(a,z):

    transactions = rd.sample(range(-10, 10), 10)  #random list of 10

    fig = go.Figure()

    fig.add_trace(go.Waterfall(
        x = [["2020", "2021", "2021", "2021", "2021", "3018", "2022", "2022", "2022"],
            ["initial", "firstRace", "secondRace", "ThirdRace", "Average", "firstRace", "secondRace", "thirdRace","Average"]],
        measure = ["absolute", "relative", "relative", "relative", "total", "relative", "relative", "relative", "total"],
        y = transactions[:9], #count  from start,
        base = a + 4,
         totals = {"marker":{"color":"deep sky blue", "line":{"color":"blue", "width":z}}}
    ))

    fig.add_trace(go.Waterfall(
        x = [["3016", "3017", "3017", "3017", "3017", "3018", "3018", "3018", "3018"],
              ["initial", "firstRace", "secondRace", "ThirdRace", "Average", "firstRace", "secondRace", "thirdRace","Average"]],
        measure = ["absolute", "relative", "relative", "relative", "total", "relative", "relative", "relative", "total"],
        y = [1, 2, 3, -1, None, 1, 2, -4, None],
        base = a + 6,
         totals = {"marker":{"color":"yellow", "line":{"color":"green", "width":z+2}}}
    ))

    fig.add_trace(go.Waterfall(
        x = [["2516", "2517", "2517", "2517", "2517", "2518", "2518", "2518", "2518"],
             ["initial", "firstRace", "secondRace", "ThirdRace", "Average", "firstRace", "secondRace", "thirdRace","Average"]],
        measure = ["absolute", "relative", "relative", "relative", "total", "relative", "relative", "relative", "total"],
        y = [0.5,z/2,z/-3,3/z,1,2,3], #shuffle from end,
        base = a - 4,
        totals = {"marker":{"color":"black", "line":{"color":"green", "width":z-3}}}
    ))

    fig.add_trace(go.Waterfall(
        x = [["2516", "2517", "2517", "2517", "2517", "2518", "2518", "2518", "2518"],
            ["initial", "firstRace", "secondRace", "ThirdRace", "Average", "firstRace", "secondRace", "thirdRace","Average"]],
        measure = ["absolute", "relative", "relative", "relative", "total", "relative", "relative", "relative", "total"],
        y = [1.1, -2.2, 3.3, 1.1, 3, 1.1, -2.2, -4.4, None,5.5,-4.4,None,None,5],
        base = a - 6,
        totals = {"marker":{"color":"black", "line":{"color":"gold", "width":z*2}}}
    ))

    fig.add_trace(go.Waterfall(
        x = [["2016", "2017", "2017", "2017", "2017", "2018", "2018", "2517", "2018"],
             ["initial", "firstRace", "secondRace", "ThirdRace", "Average", "firstRace", "secondRace", "thirdRace","Average"]],
        measure = ["absolute", "relative", "relative", "relative", "total", "relative", "relative", "relative", "total"],
        y = [1.1, -2.2, 3.3, 1.1, 3, 1.1, -2.2, -4.4, None,5.5,-4.4,None,None,5],
        base = a + 8,
        totals = {"marker":{"color":"white", "line":{"color":"blue", "width":z+7}}}
    ))

    fig.add_trace(go.Waterfall(
        x = [["3016", "2017", "3017", "2017", "3017", "3018", "3018", "3018", "3018"],
            ["initial", "firstRace", "secondRace", "ThirdRace", "Average", "firstRace", "secondRace", "thirdRace","Average"]],
        measure = ["absolute", "relative", "relative", "relative", "total", "relative", "relative", "relative", "total"],
        y = [1.1, -2.2, 3.3, 1.1, 3, 1.1, -2.2, -4.4, None,5.5,-4.4,None,None,5],
        base = a-3,
        totals = {"marker":{"color":"black", "line":{"color":"gold", "width":z}}}
    ))

    fig.update_layout(
        waterfallgroupgap = (z*z)/a,
    )

    fig.update_layout(xaxis=dict(visible=False), yaxis=dict(visible=False)) #removing axes

    fig.show()