HexylViewPoint
For my 25th sketch of Mathober2025 coded in Python, HexylViewPoint takes the 29th prompt of Hexyl and uses the chemical Hexyl acetate as a focal point to graph various melting and boiling points.
Poetry
Directions
Flowing out of Relations
Sensations
Manufactured from Chemical Reactions
Melting and boiling that changes their Formations
Images


Melting Point Data and Boiling Data :
https://www2.chemistry.msu.edu/faculty/reusch/virttxtjml/physprop.htm
Hexyl acetate :
Chemical Formula: C8H16O2
Whole Ratio: C4H8O
Melting Temp: -80 C
Boiling Point: 156 C
Code
Radial Graph
import plotly.express as px
import pandas as pd
fig = px.line_polar(df, r= df['Melting Point'], theta=df['Compound'], line_close=True)
fig.update_traces(fill='toself')
fig.show()

import plotly.express as px
import pandas as pd
fig = px.line_polar(df, r= df['Boiling Point'], theta=df['Compound'], line_close=True)
fig.update_traces(fill='toself')
fig.show()

Heatmap
df.style.background_gradient(cmap ='viridis')\
        .set_properties(**{'font-size': '20px'})

Bar Graphs
import pandas as pd
import seaborn as sns
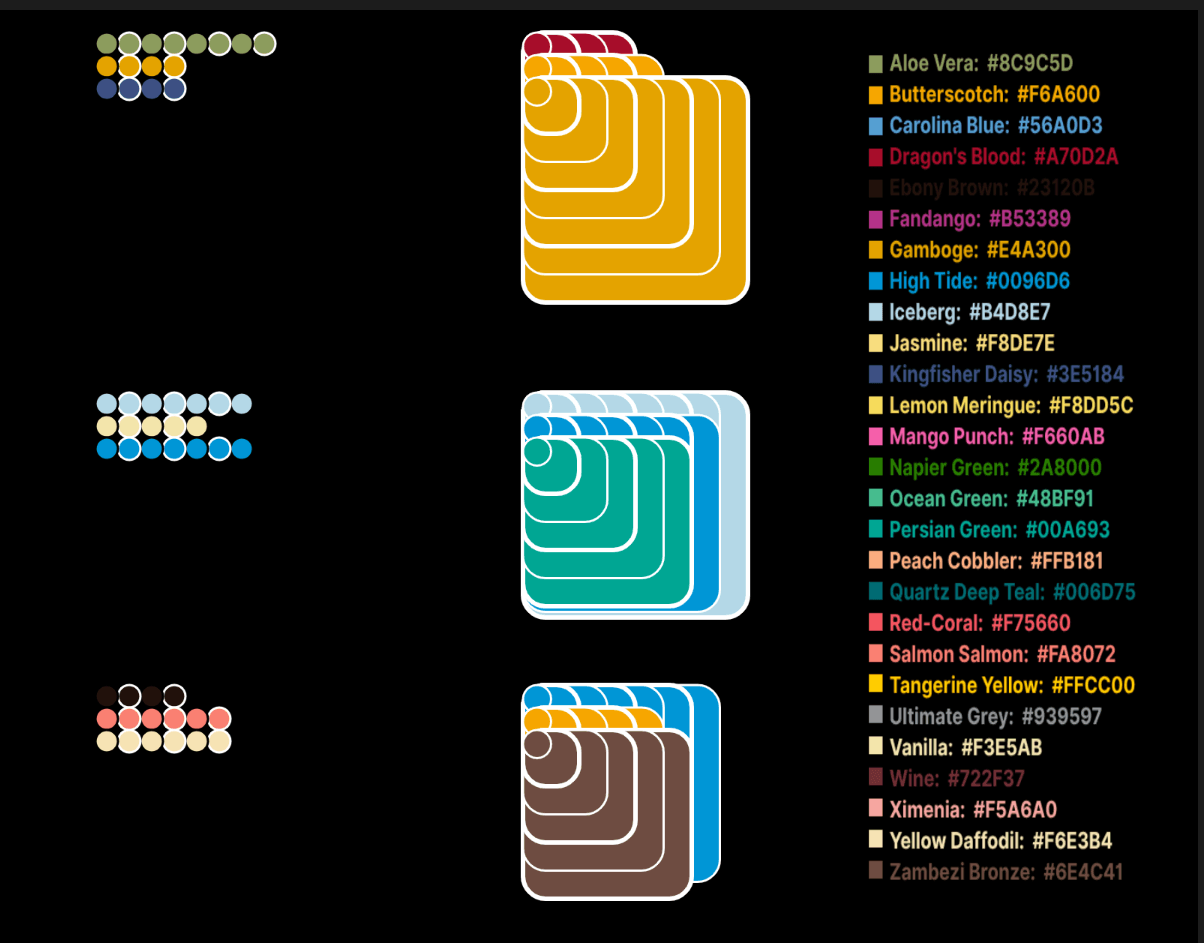
sns.barplot(x="Compound", y="Melting Point", data=df, palette = 'pastel')

import pandas as pd
import seaborn as sns

sns.barplot(x="Compound", y="Boiling Point", data=df, palette = 'pastel')