GraphableOres
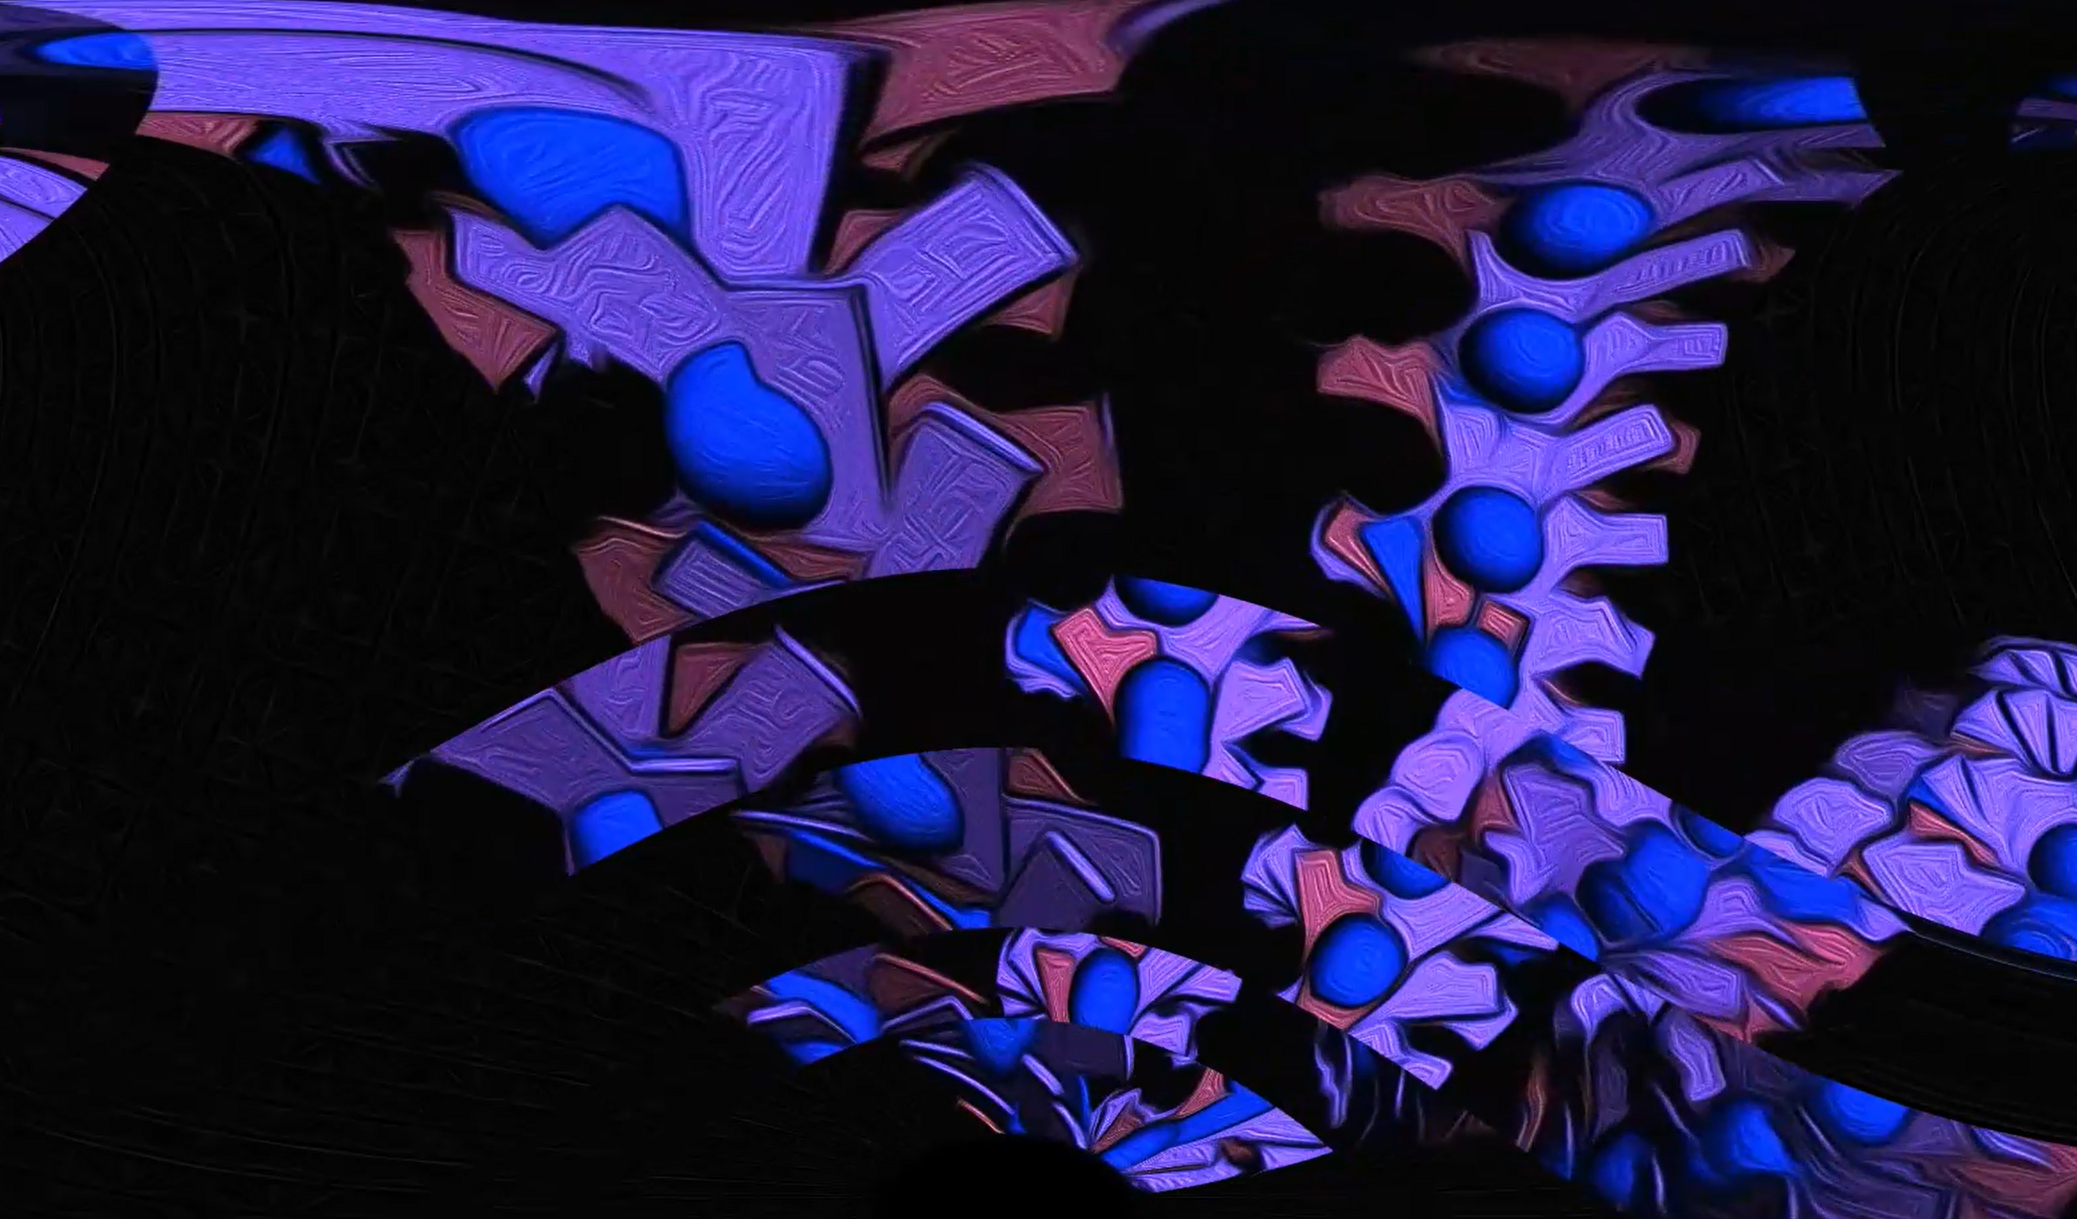
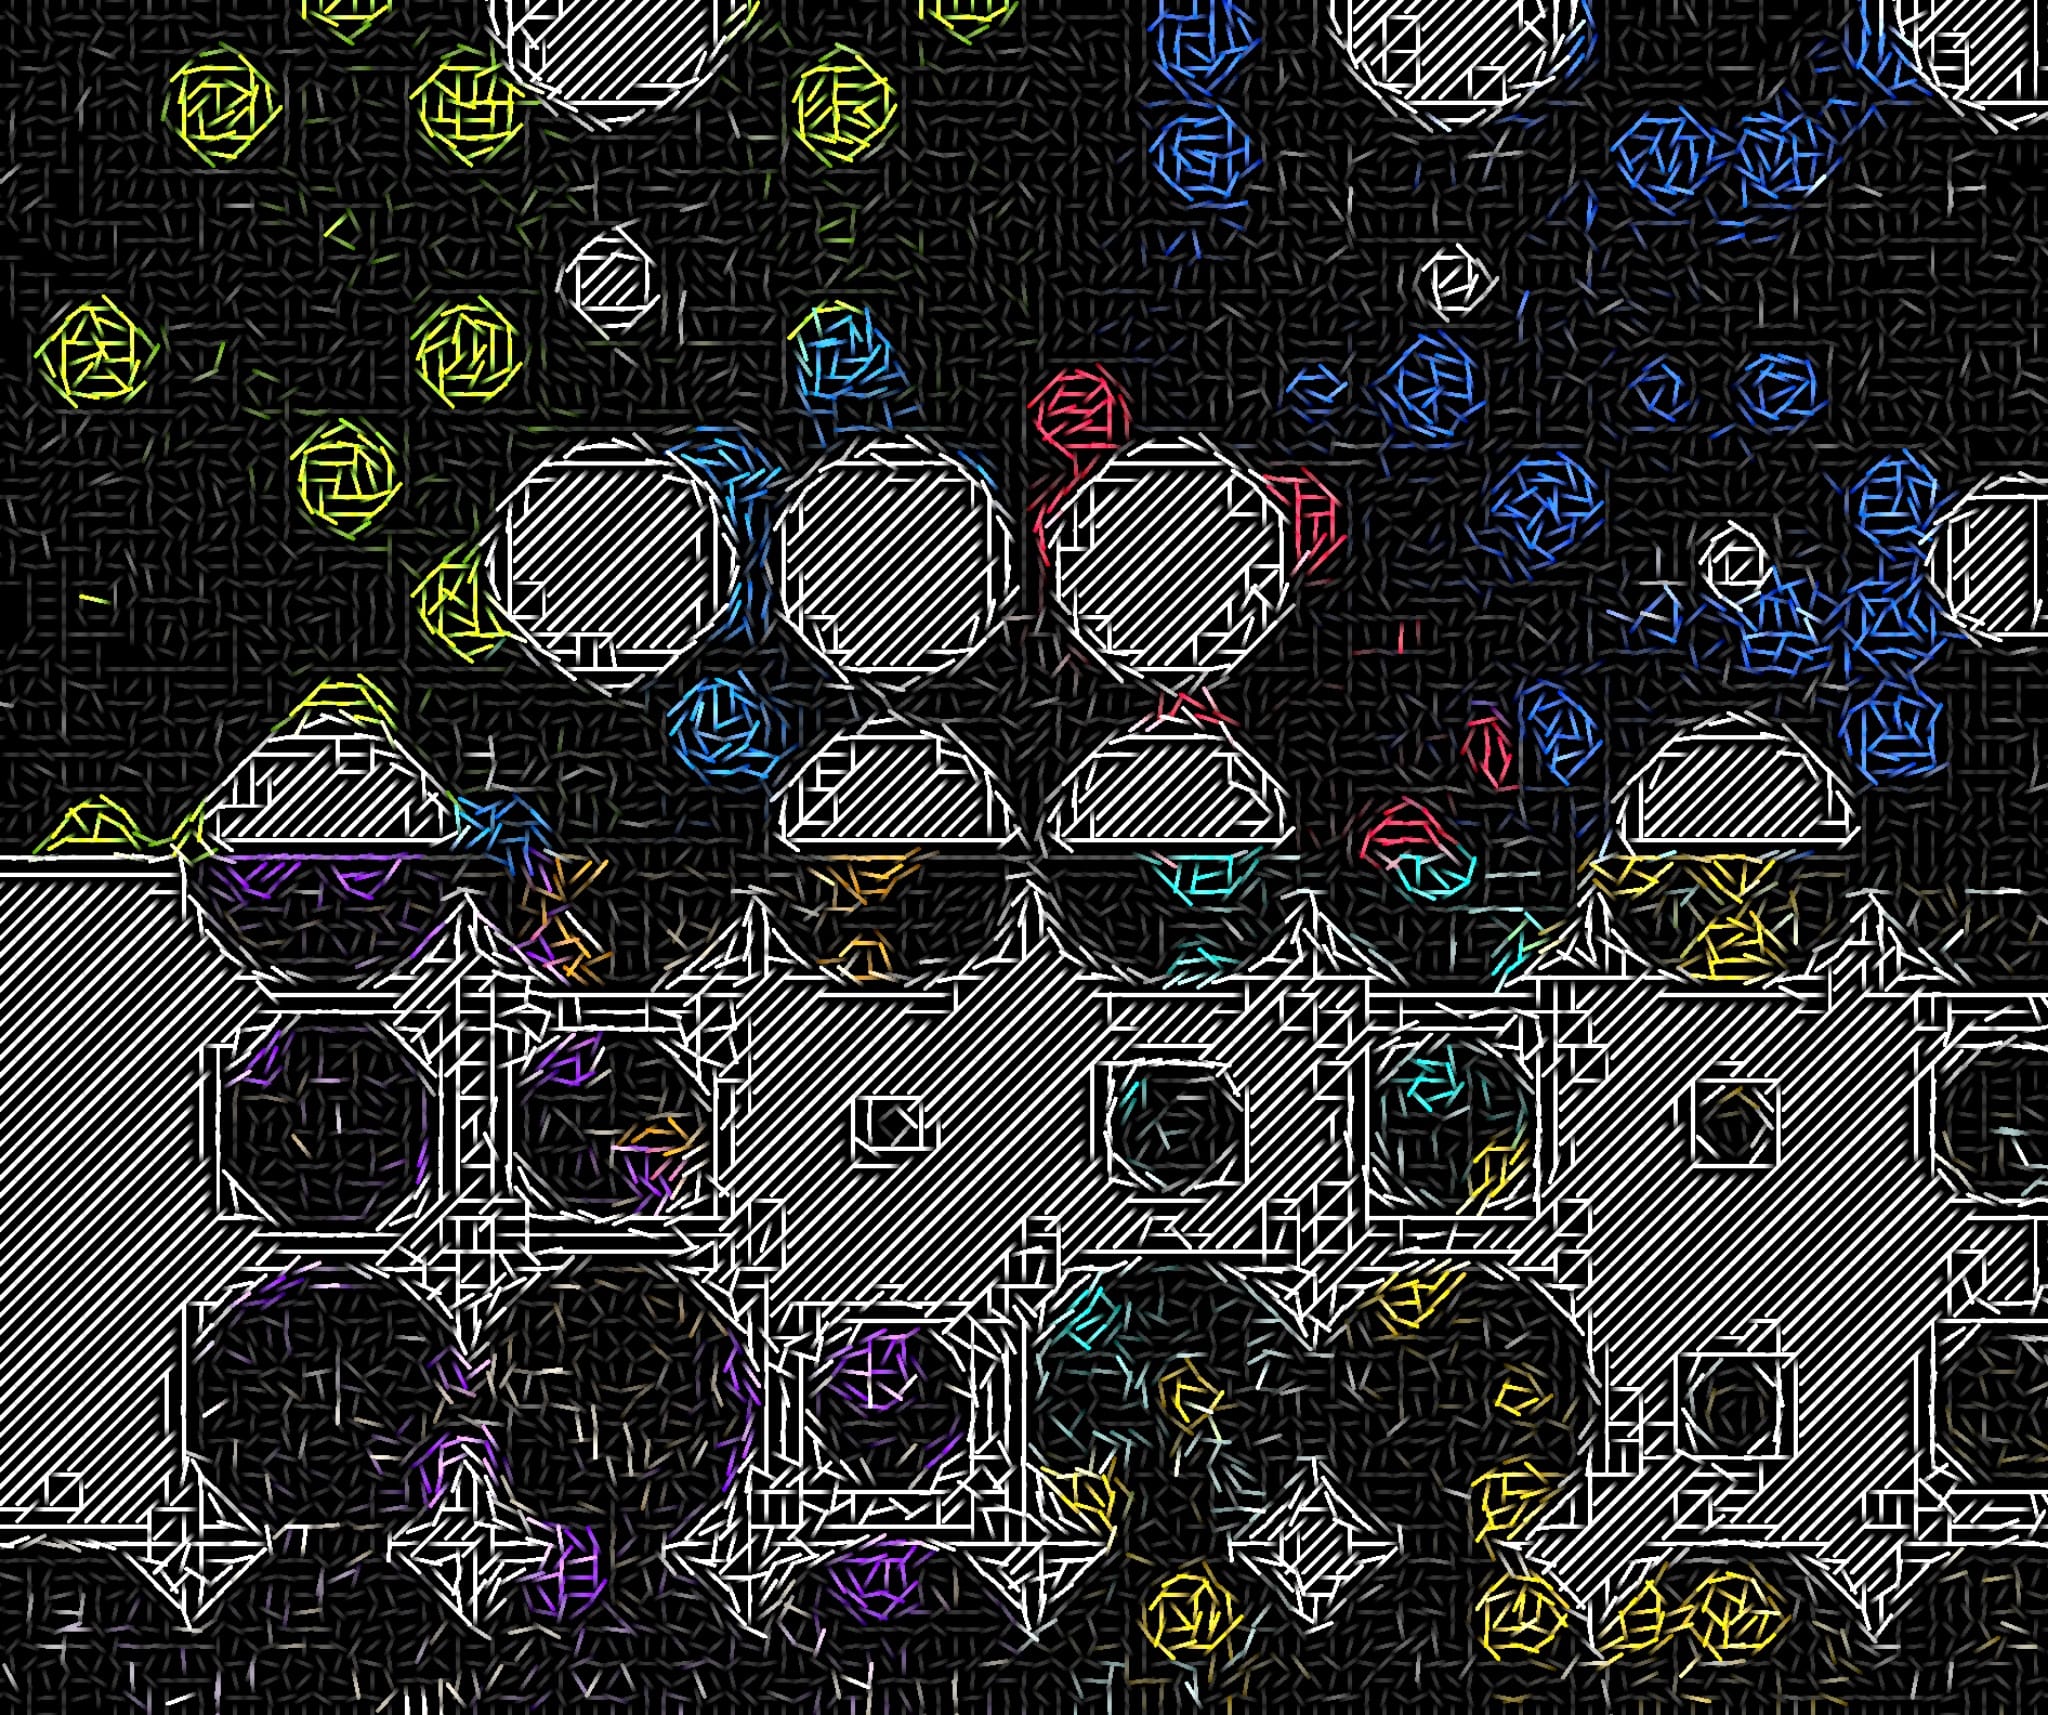
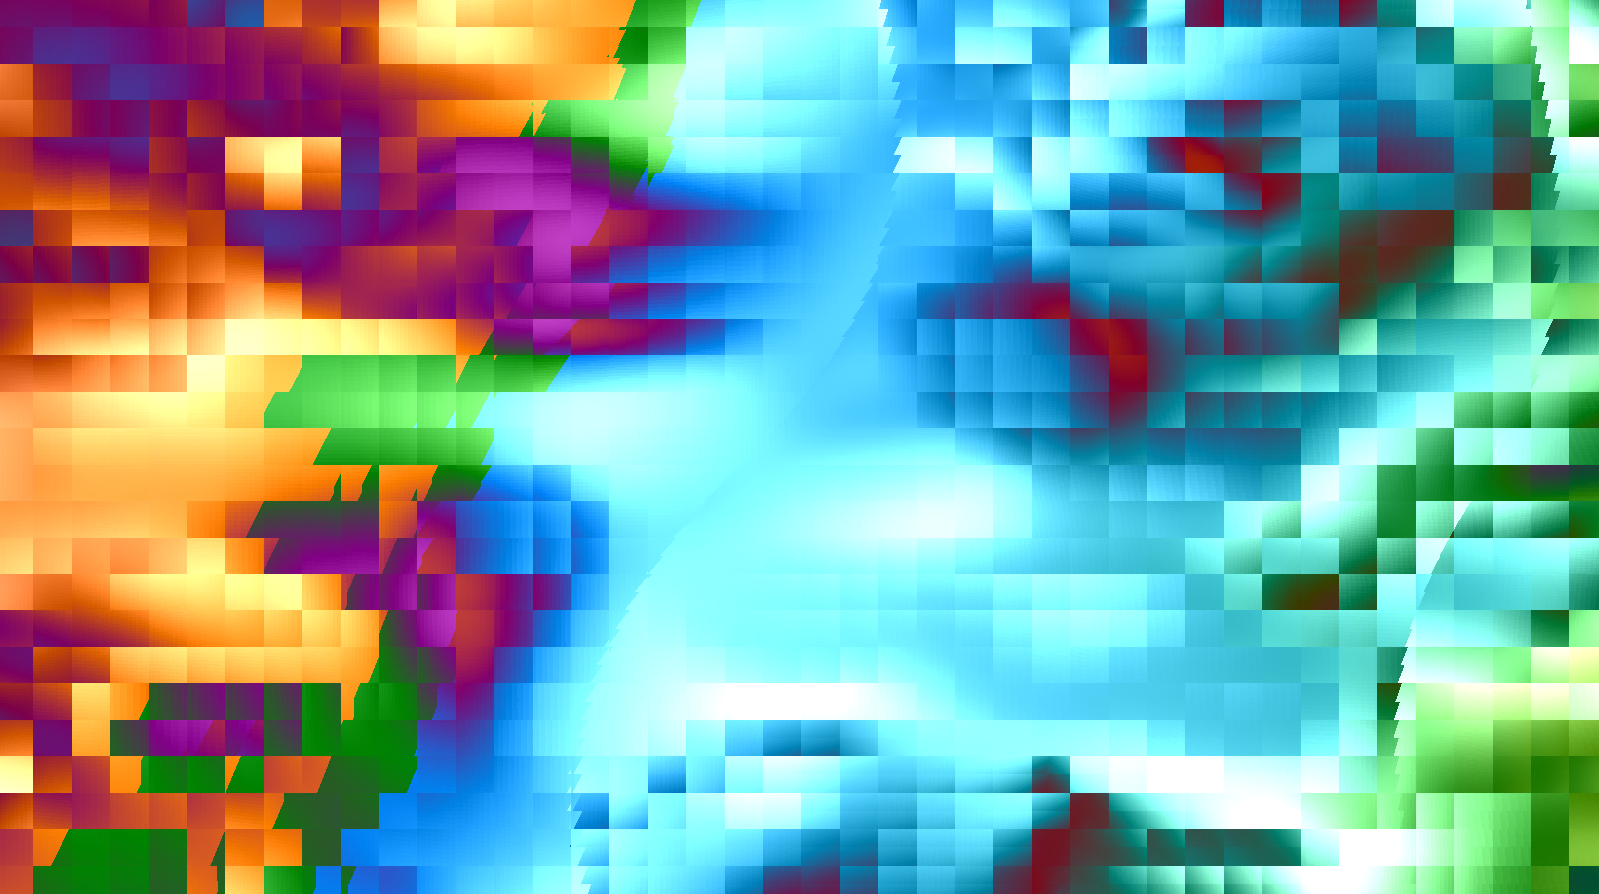
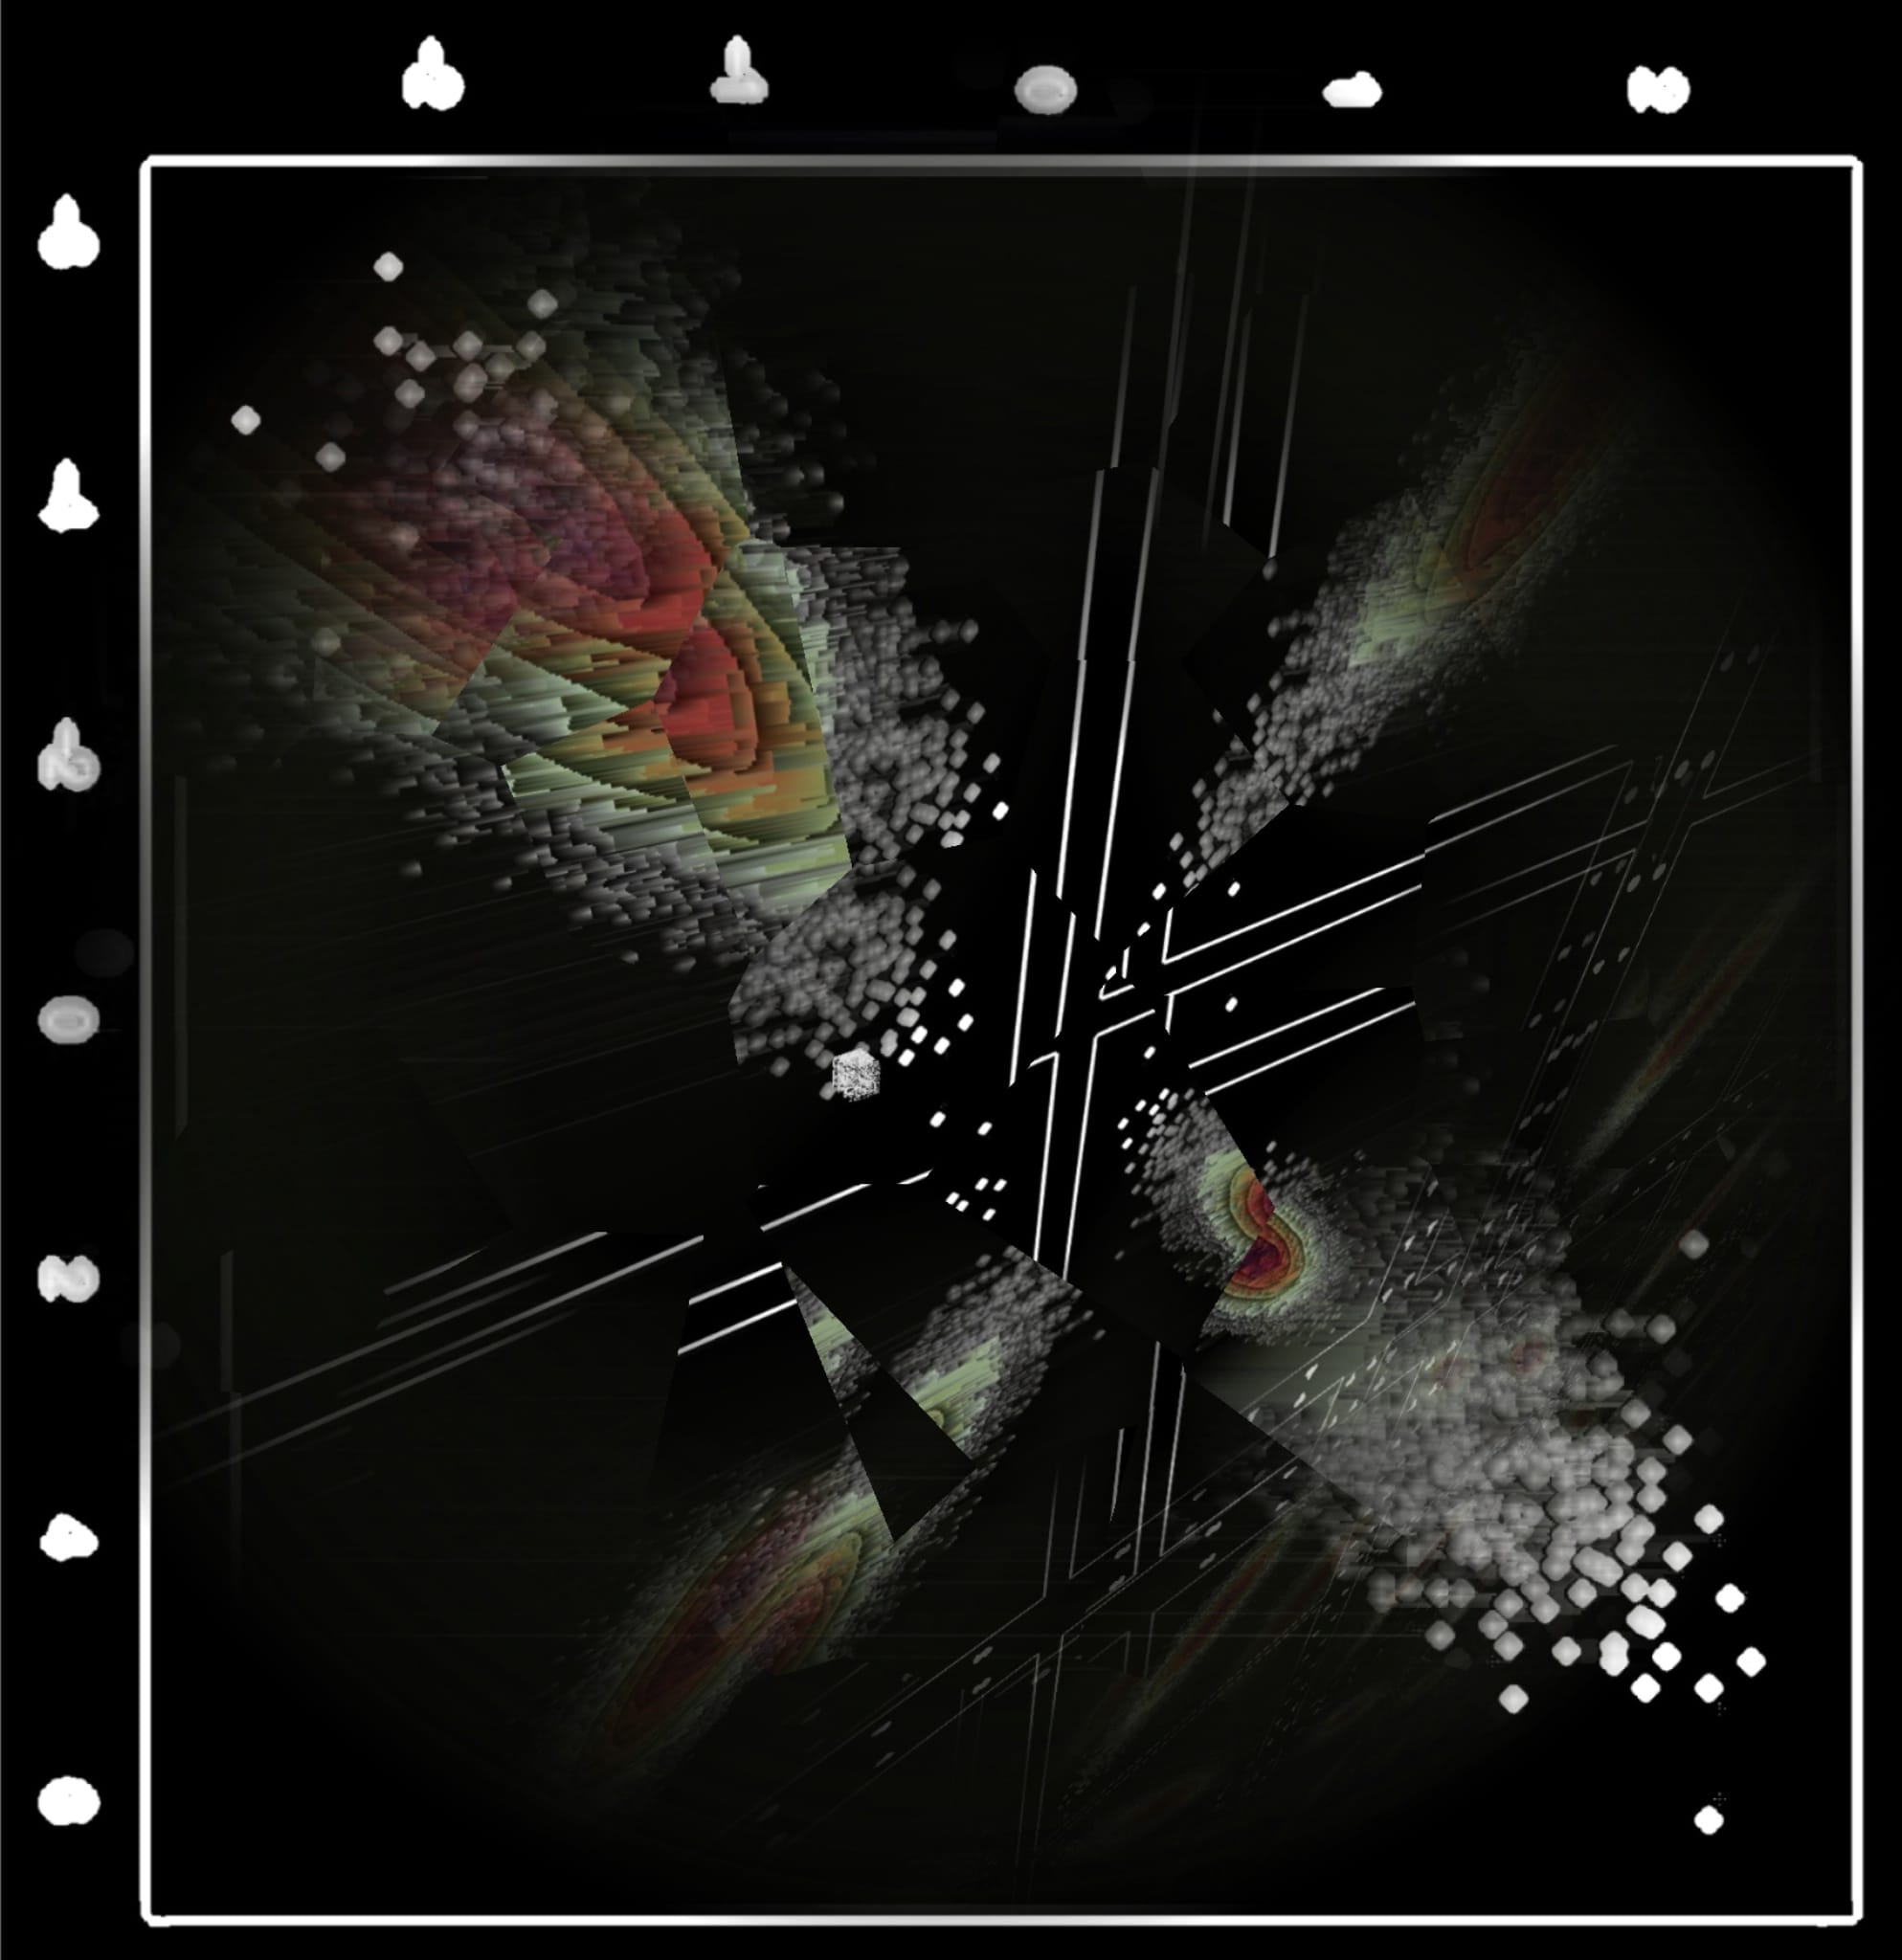
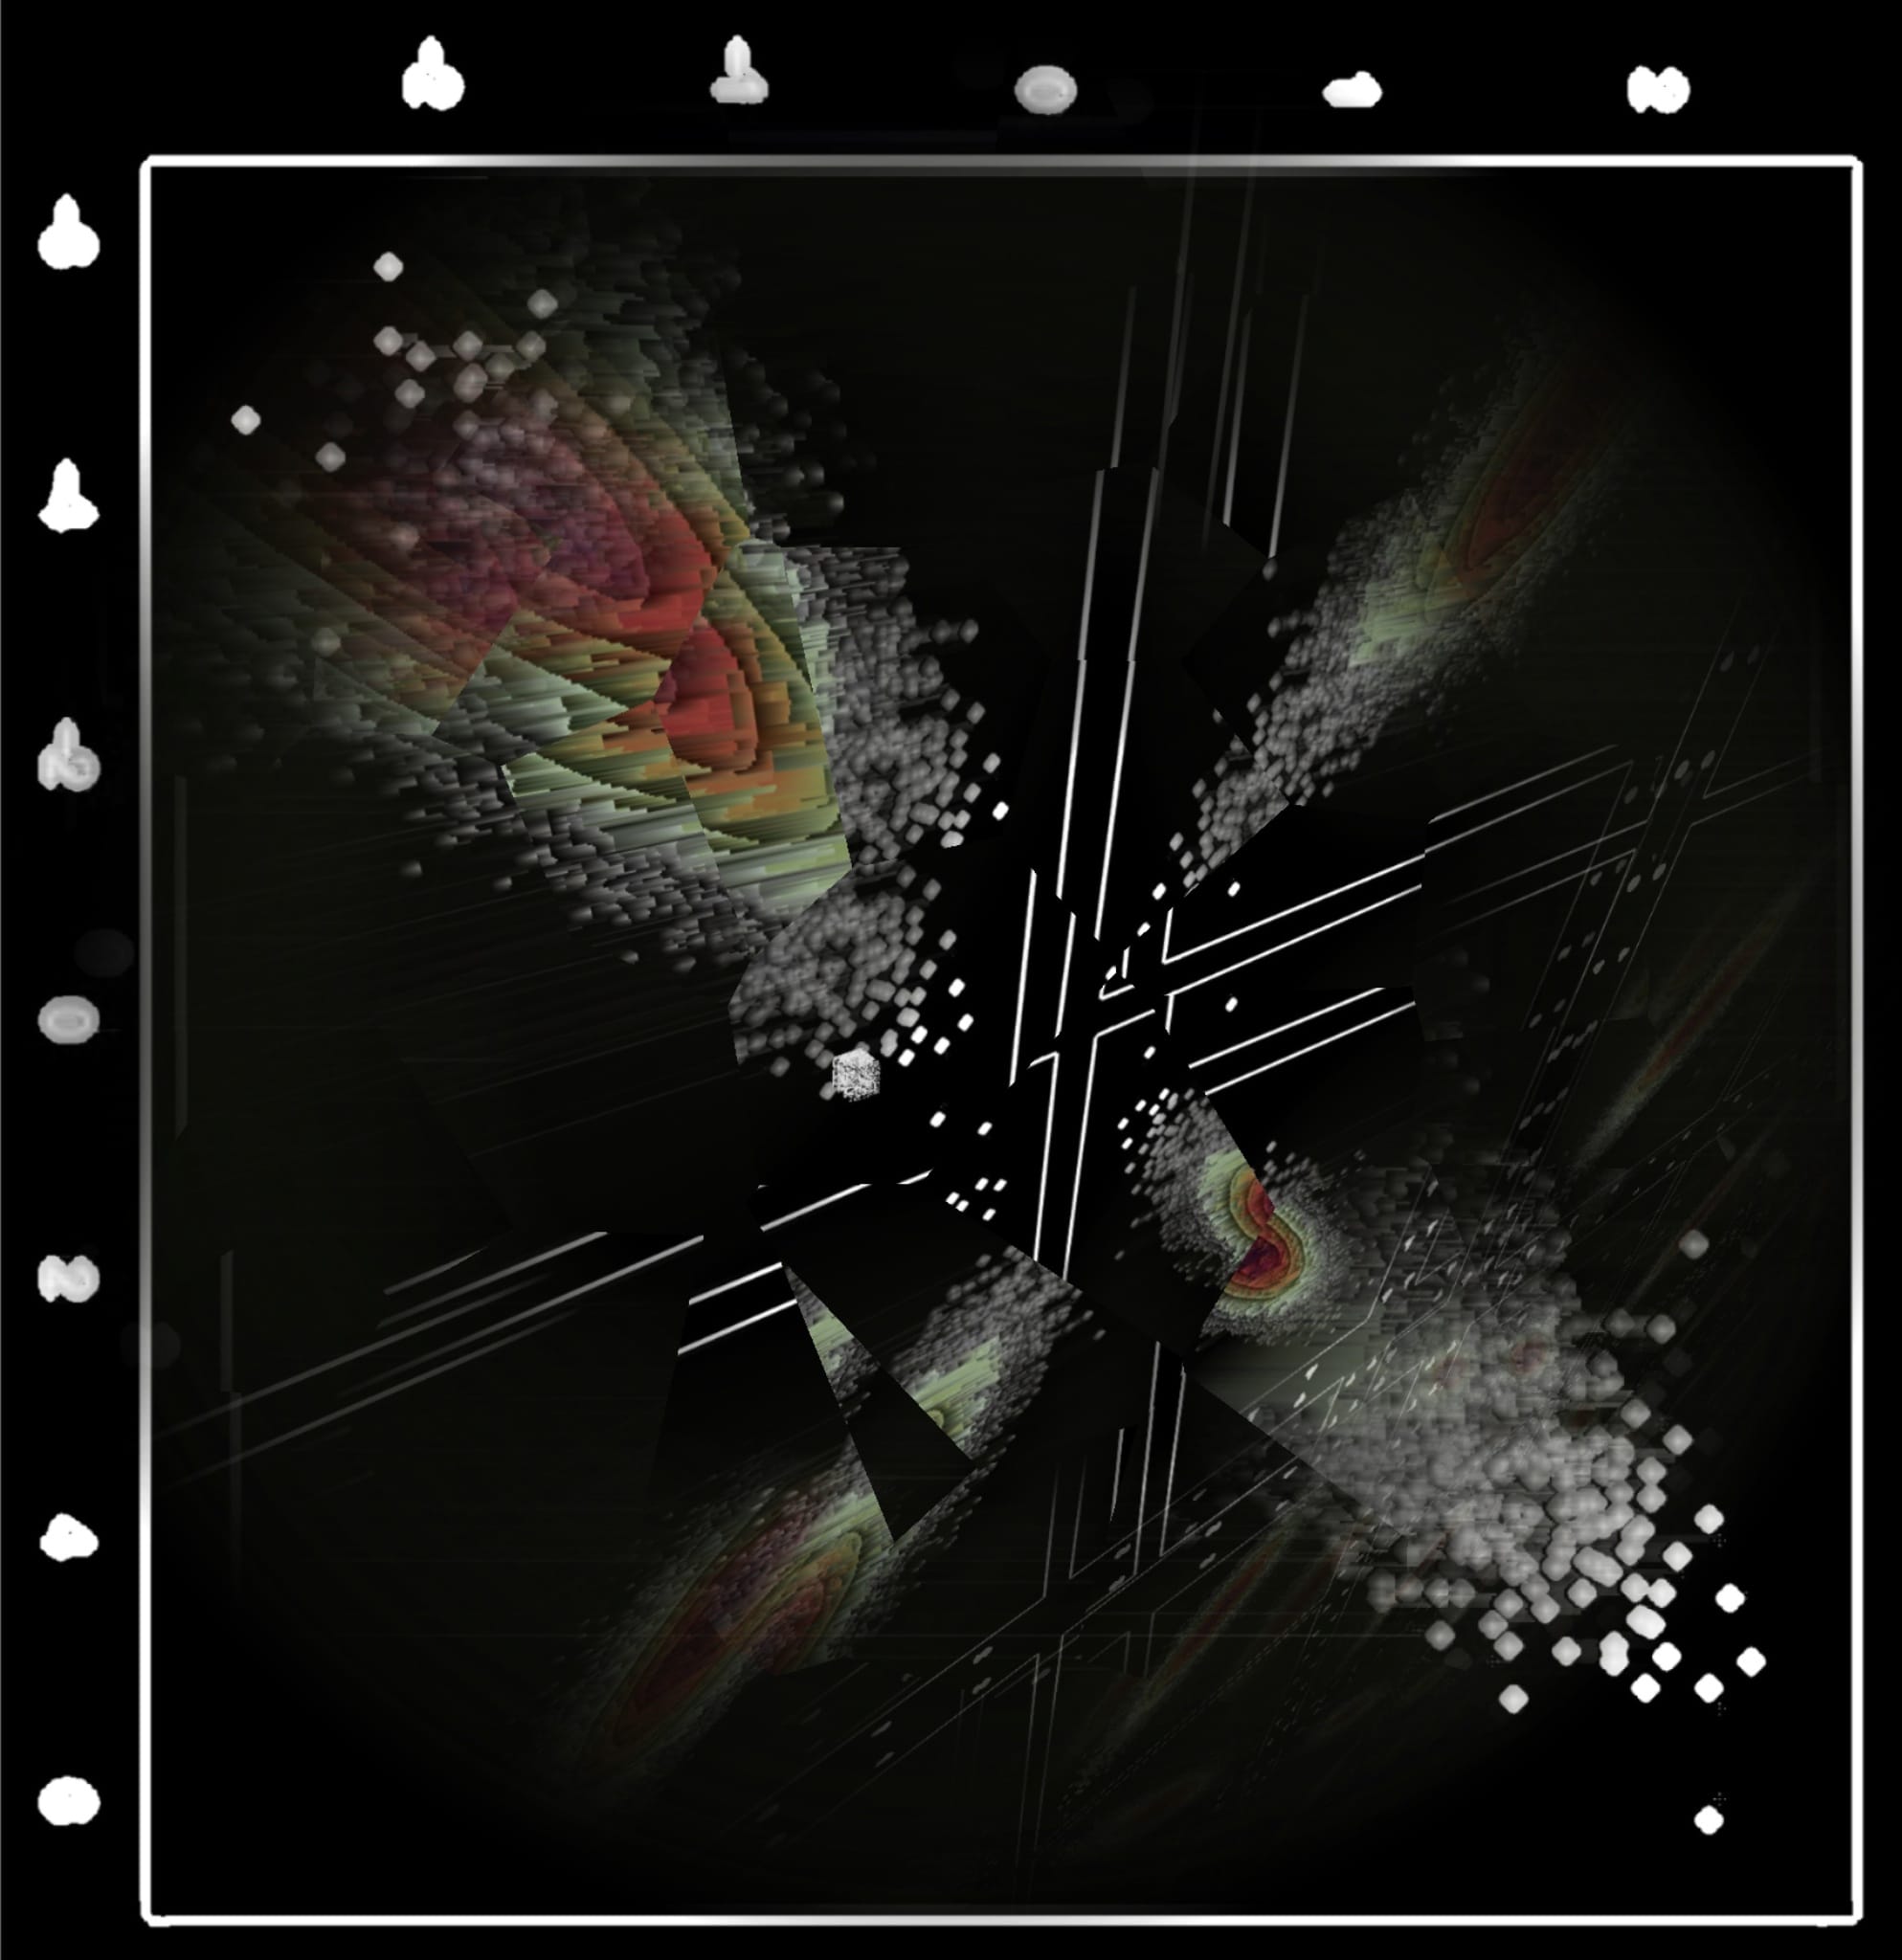
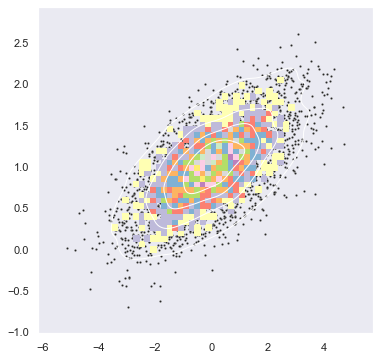
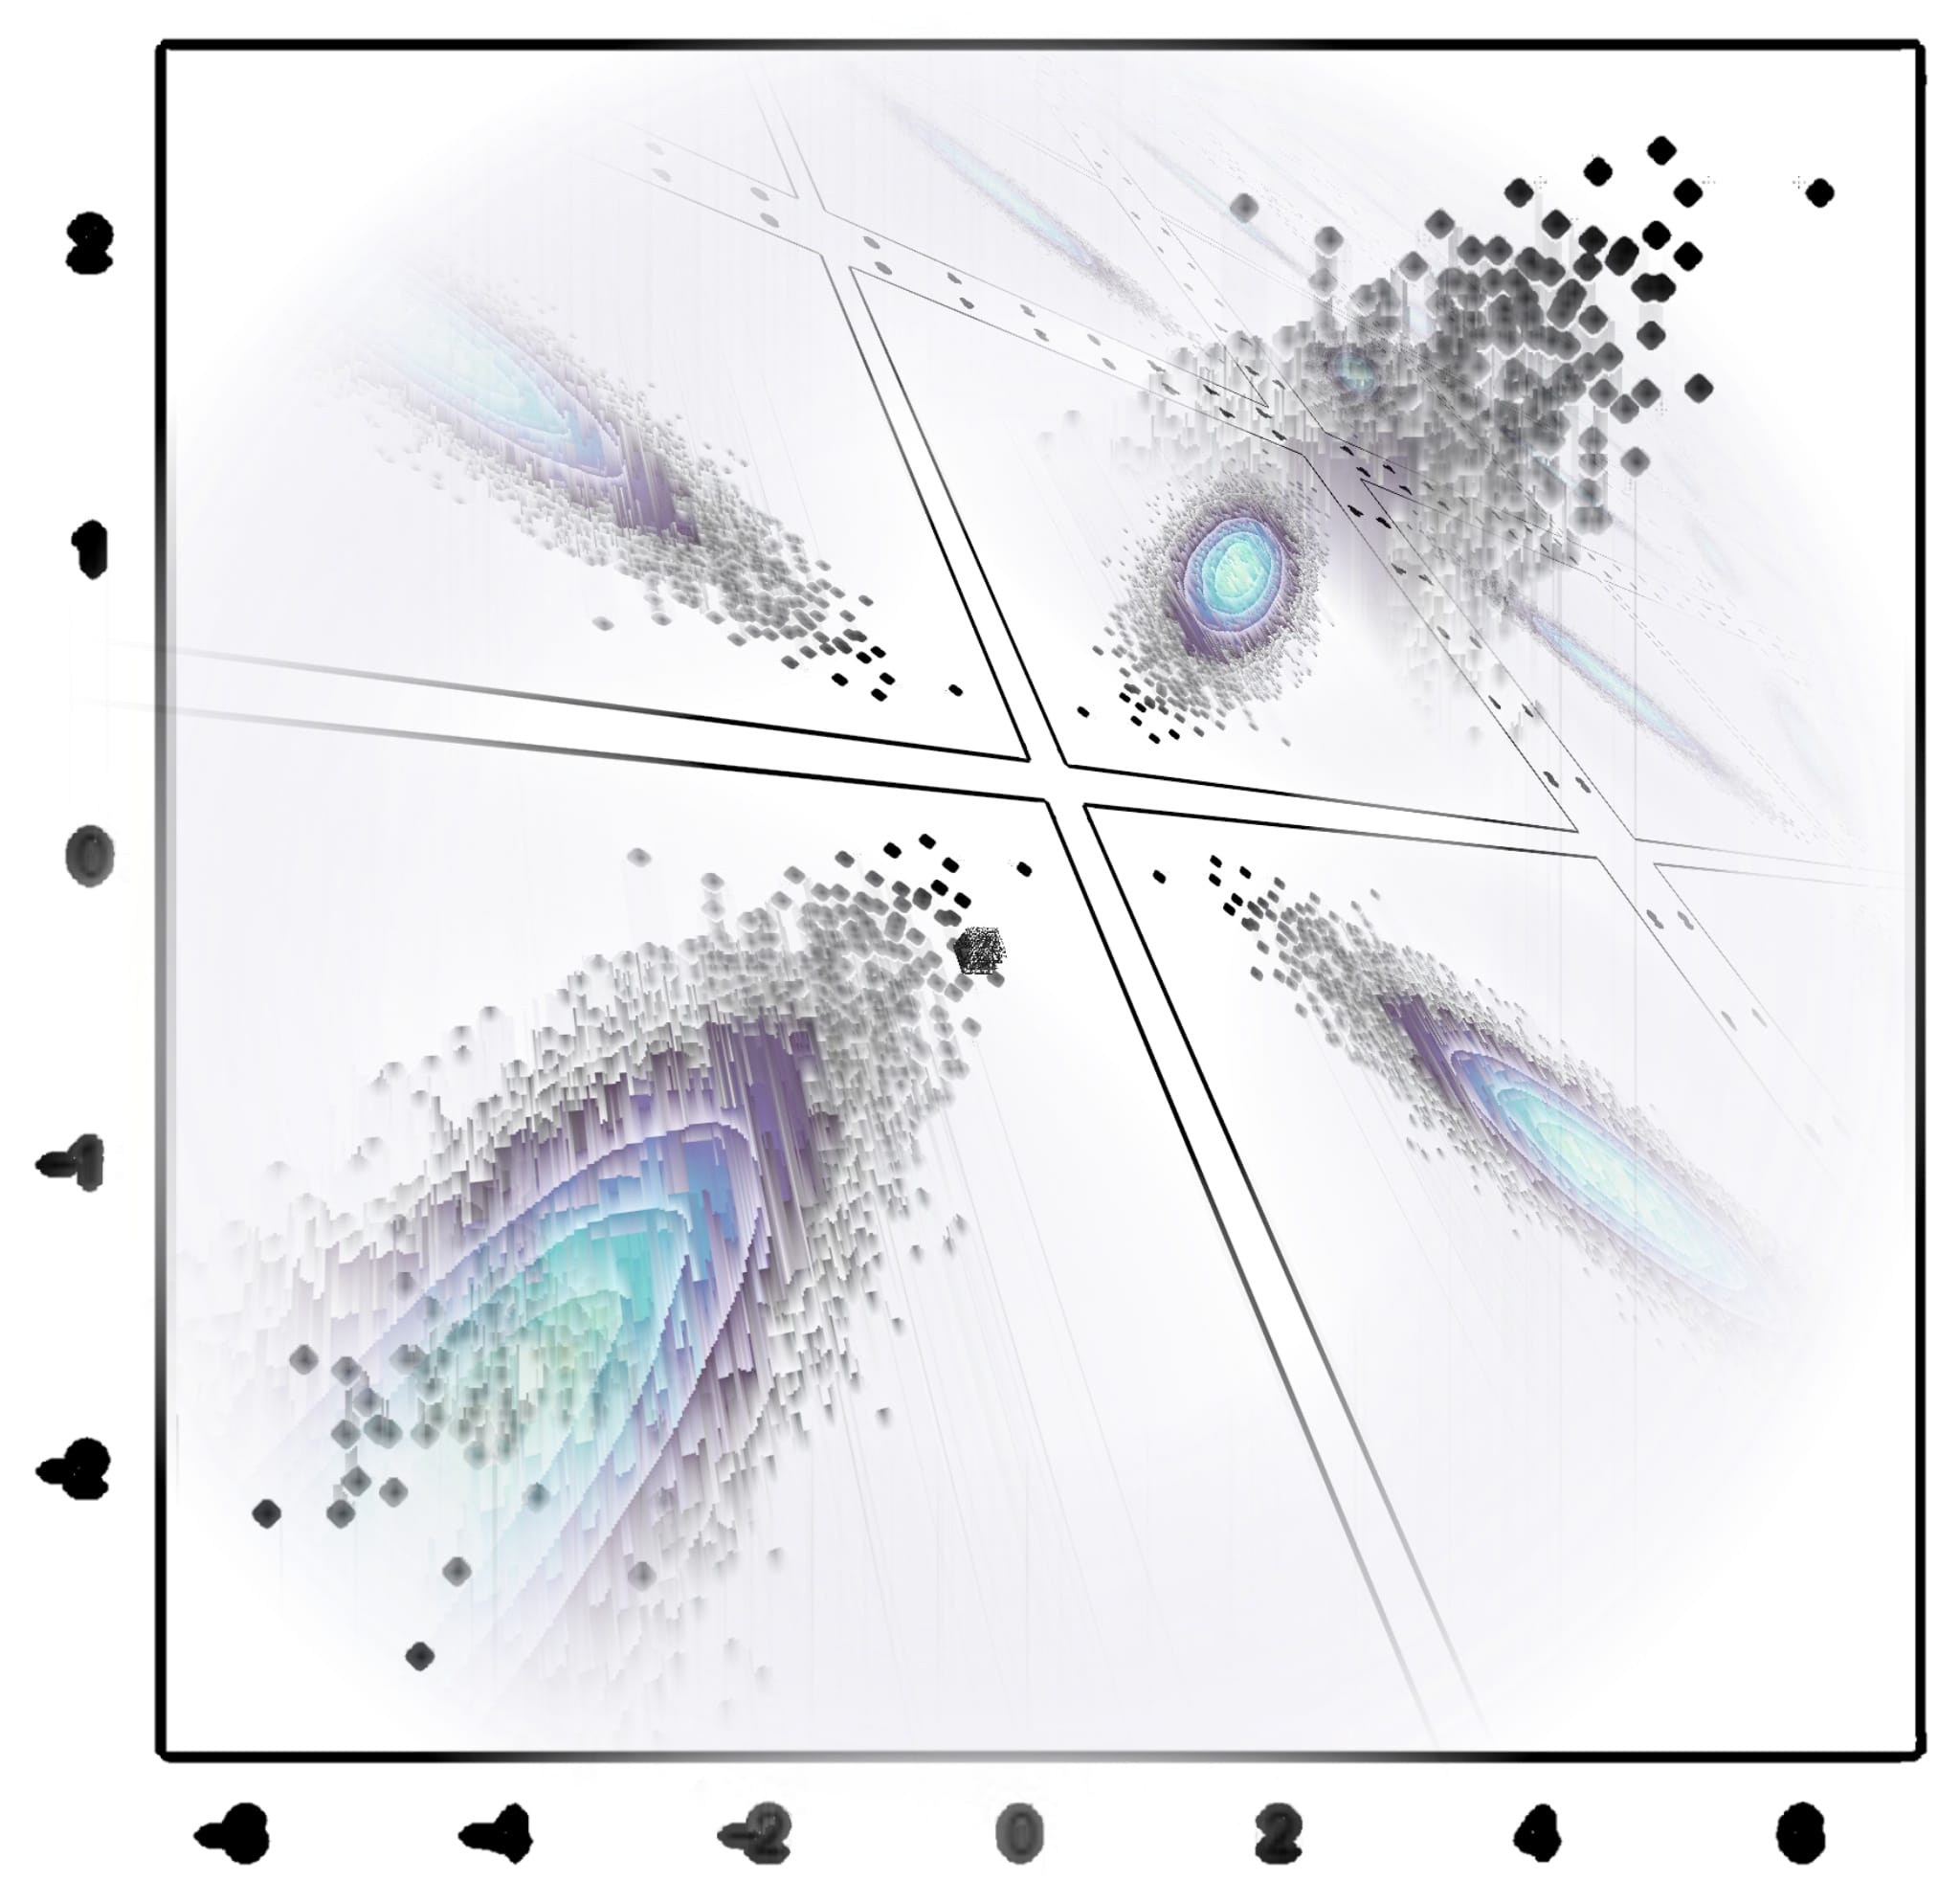
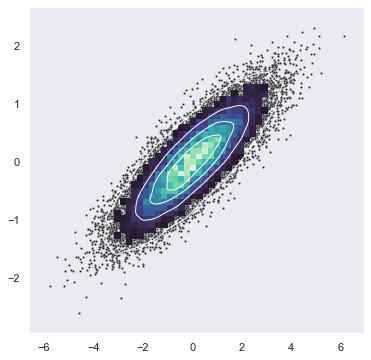
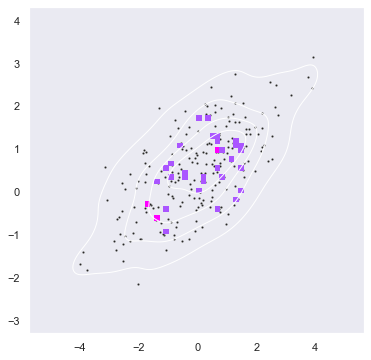
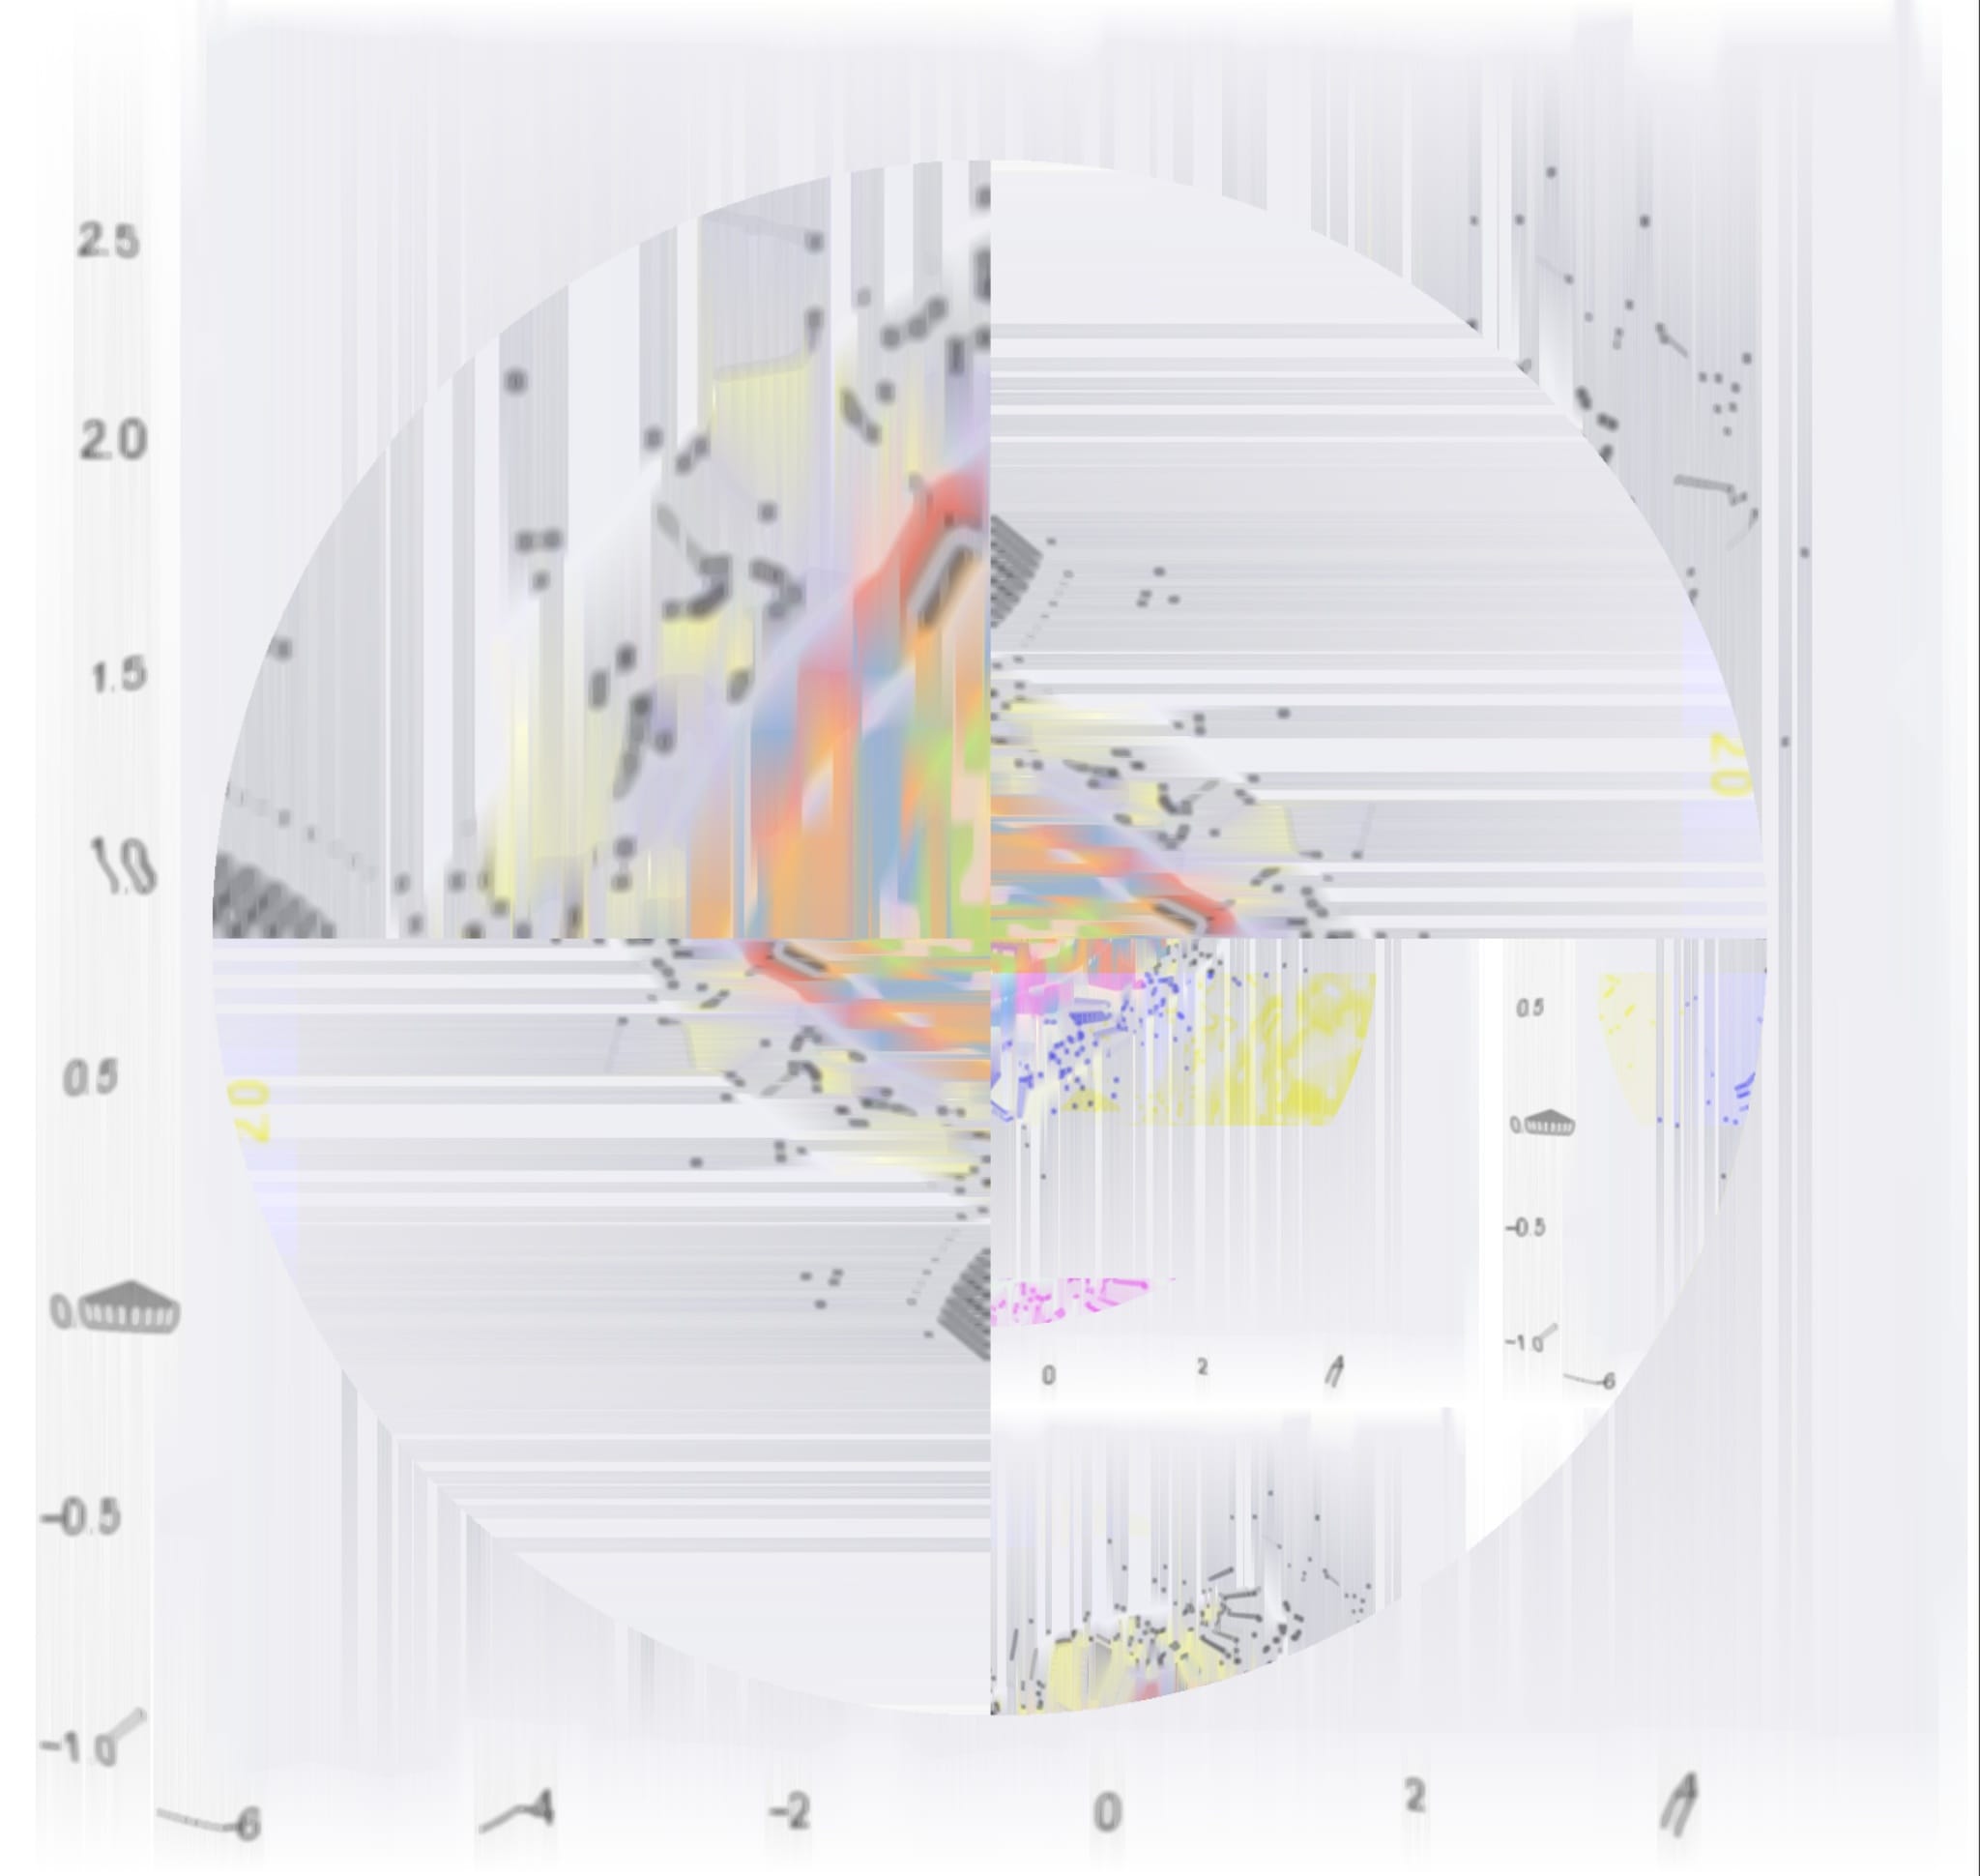
For my eighth sketch of Mathober2024, GraphableOres is coded in Python with a Ore-like graph that is being stretched and morphed through Glitchlab. Flexible Graph is the 7th Prompt for this year’s Mathober.
Poetry
Shaking and Flipping
Tilting and twisting
Spinning and Tipping
Over and Under,
As they wander,
Into a whole new listing
Images
Python Code
import numpy as np
import seaborn as sns
import matplotlib.pyplot as plt

def plotting(num,var_mean1,var_mean2,rate,styling):

    sns.set_theme(style="dark")

    # Simulate data from a bivariate Gaussian
    n = num
    mean = [0, var_mean2]
    cov = [(2, var_mean1), (var_mean1, .2)]
    rng = np.random.RandomState(rate)
    x, y = rng.multivariate_normal(mean, cov, n).T

    # Draw a combo histogram and scatterplot with density contours
    f, ax = plt.subplots(figsize=(6, 6))
    sns.scatterplot(x=x, y=y, s=5, color=".15")
    sns.histplot(x=x, y=y, bins=50, pthresh=.1, cmap= styling)
    sns.kdeplot(x=x, y=y, levels=5, color="w", linewidths=1)

plotting(5000,0.4,1,5,'Set3')
plotting(20000,0.8,0,10,'mako')
plotting(250,1.2,0.5,3,'cool')