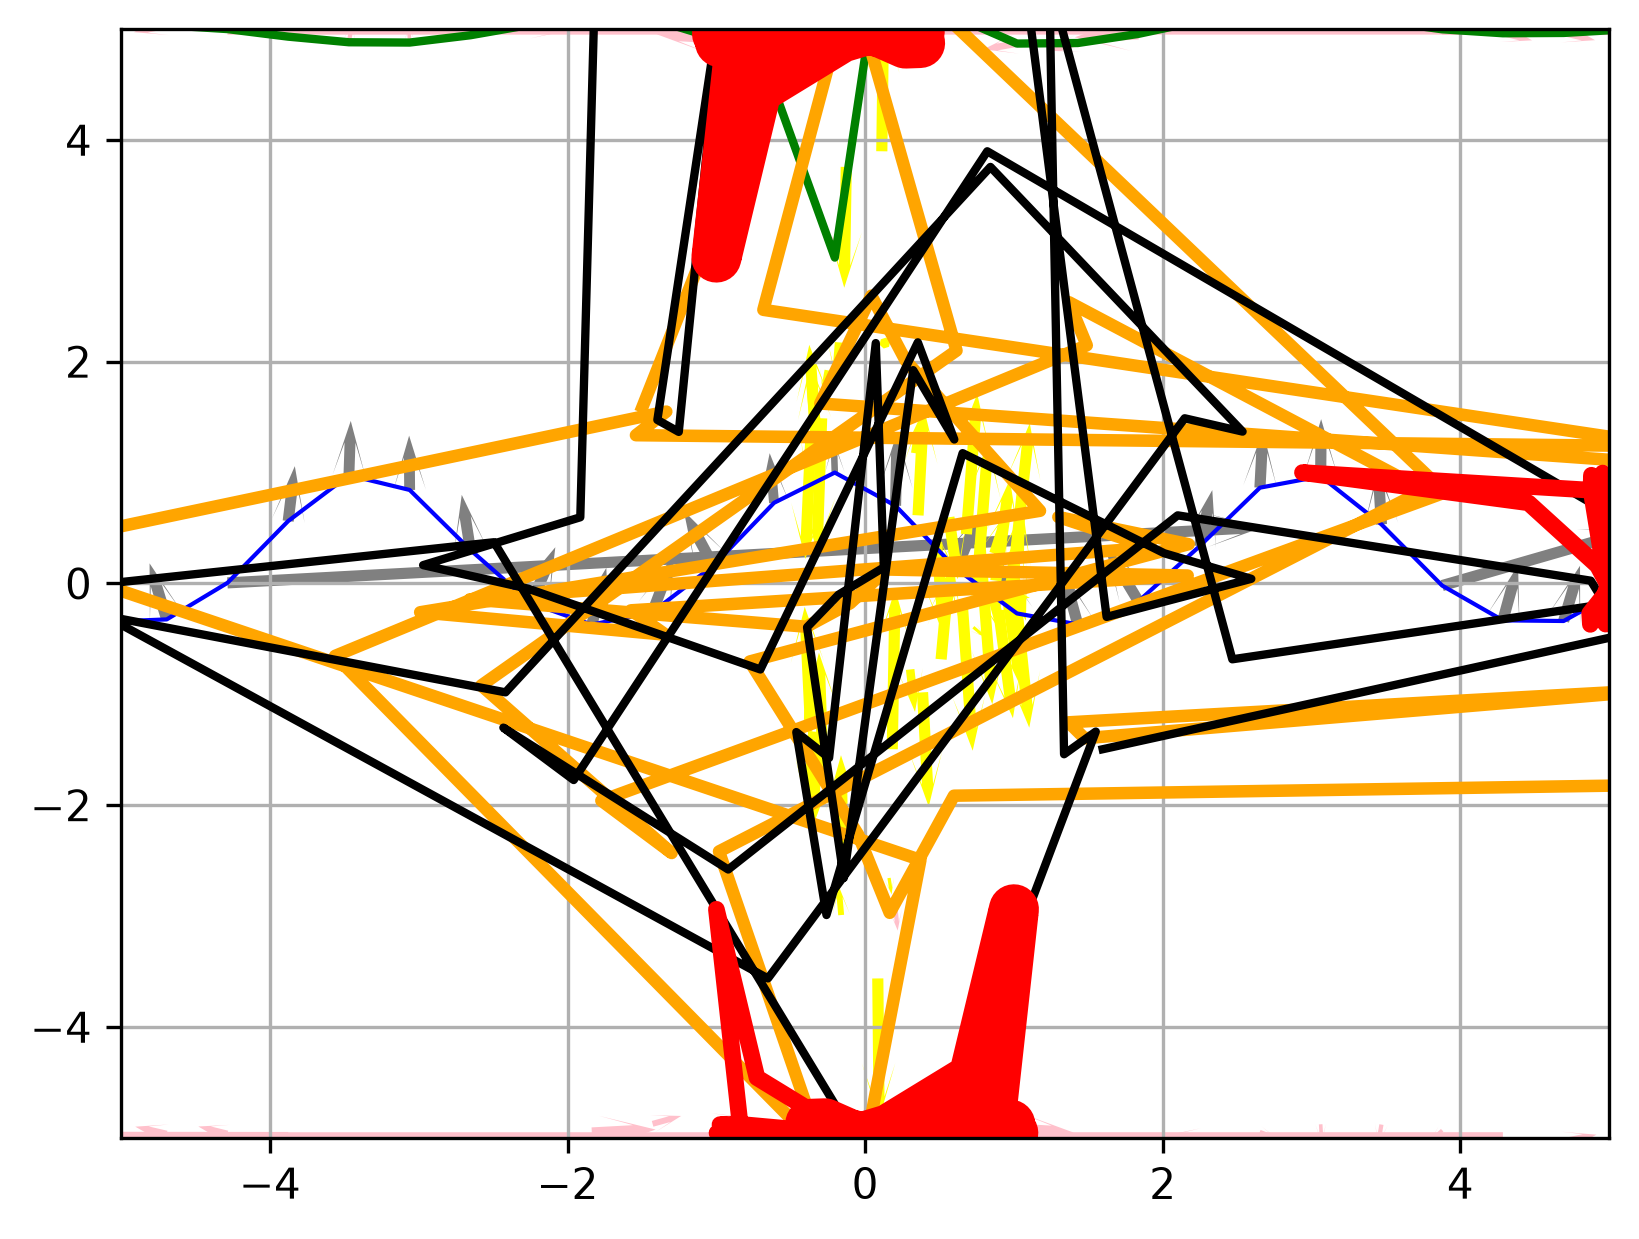
NoiseyChaoticForms
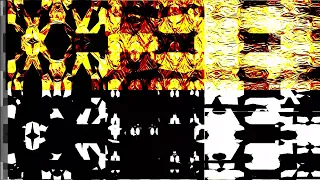
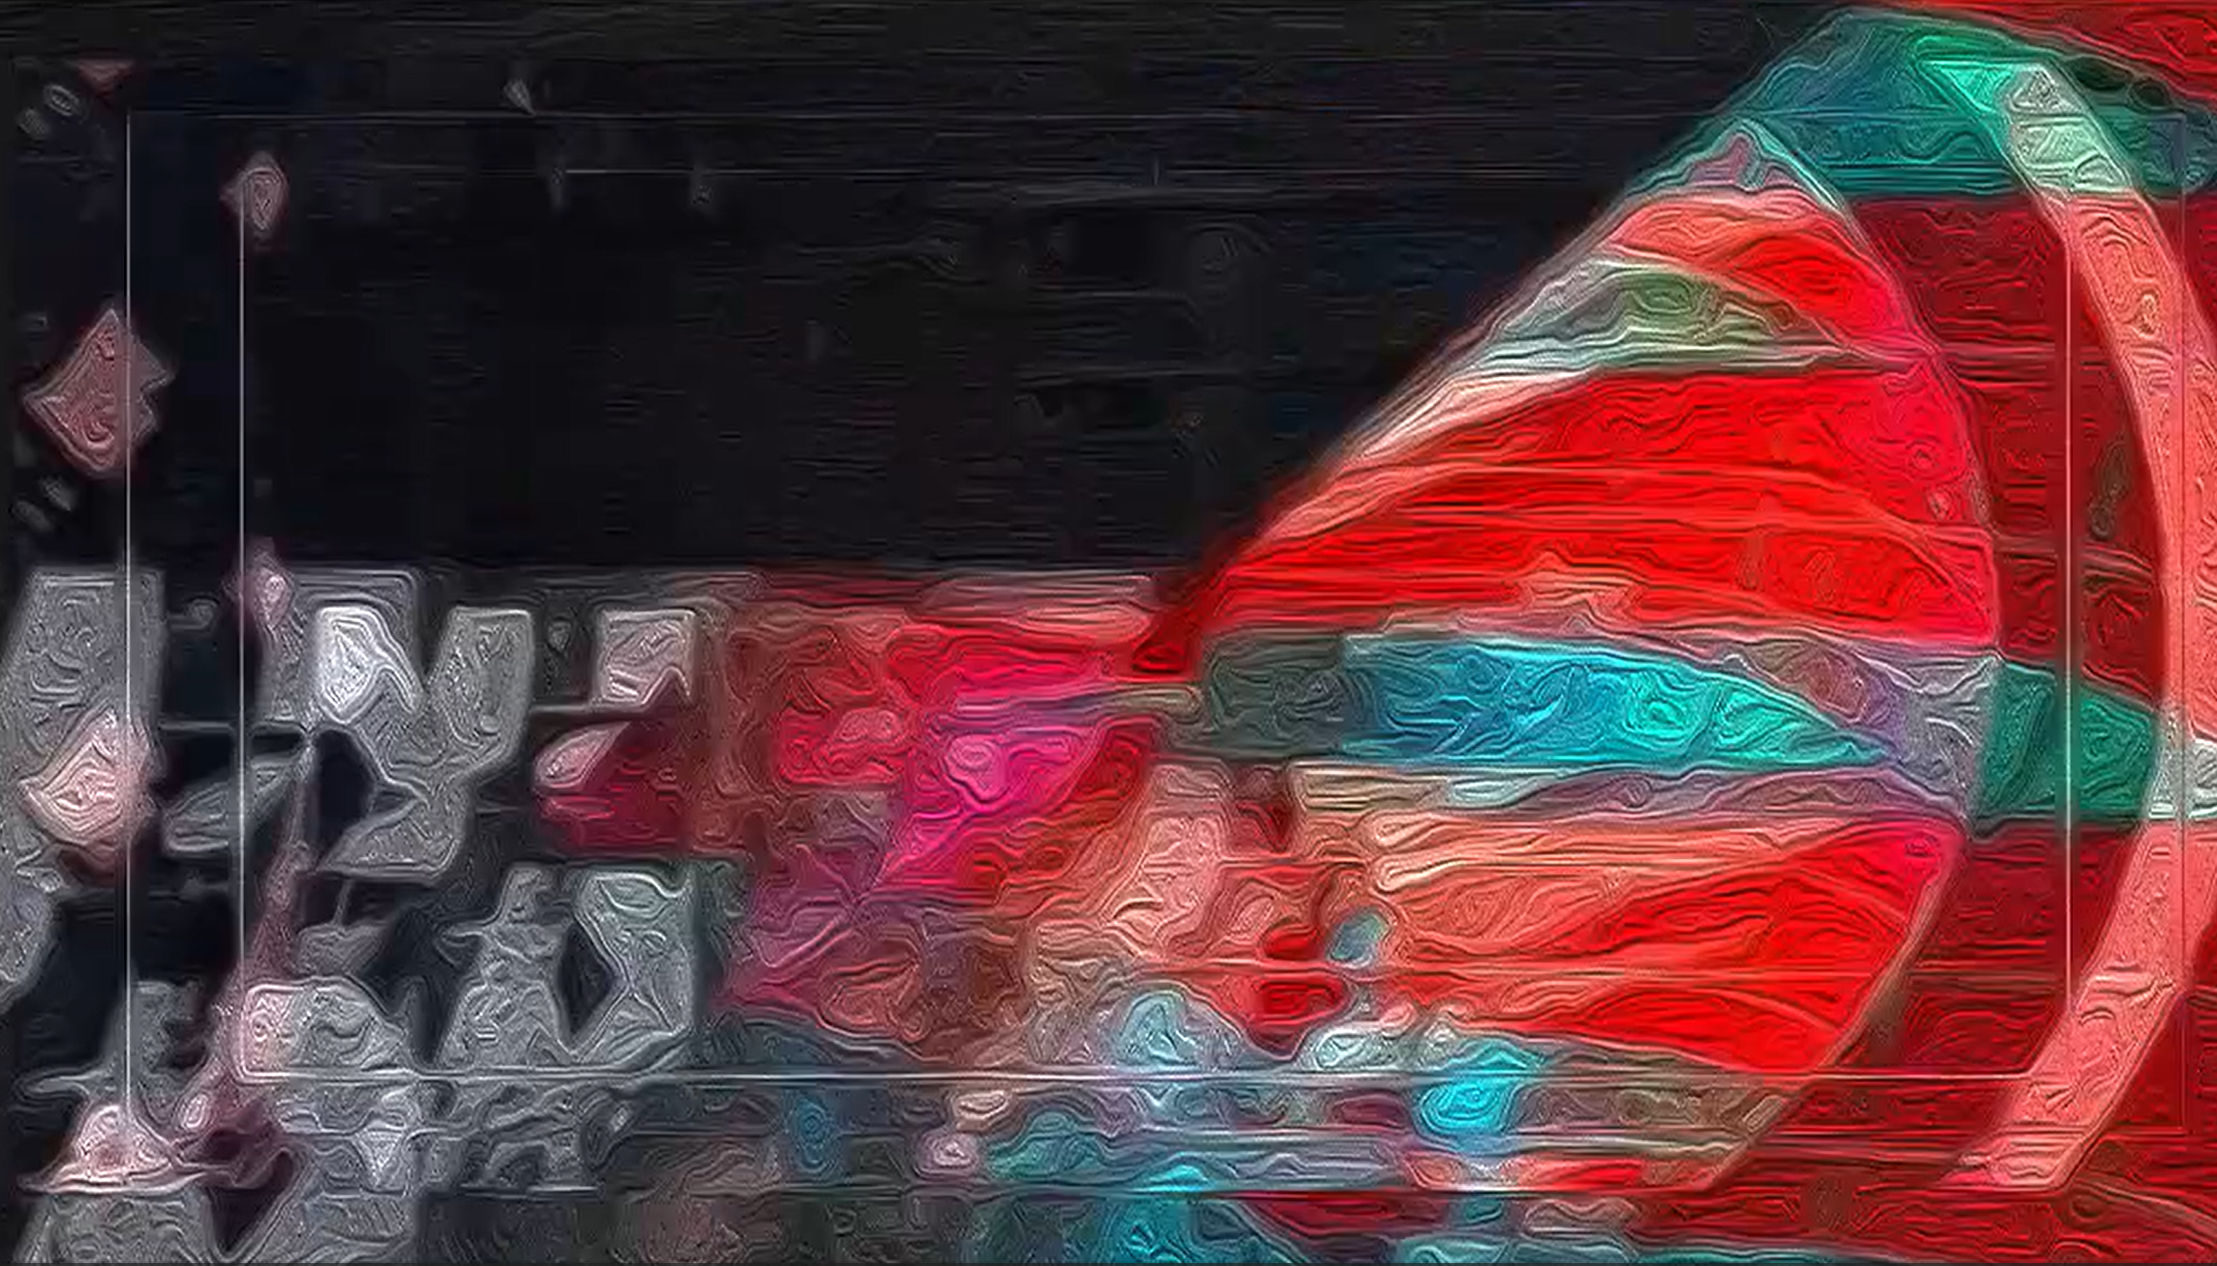
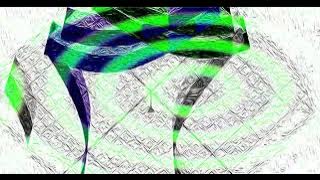
For this week's Creative Code Challenge by @sableraph: "Waveforms”, NoiseyChaoticForms coded with Python explores waveforms through the lens of chaotic algorithmic doodling/graphing
Poetry
Waves can Vary
With the results
Verging through consults
As it adds to its story
As the doodles
The lines
Twist and Curls like a noodle
But not edible, this time
Images
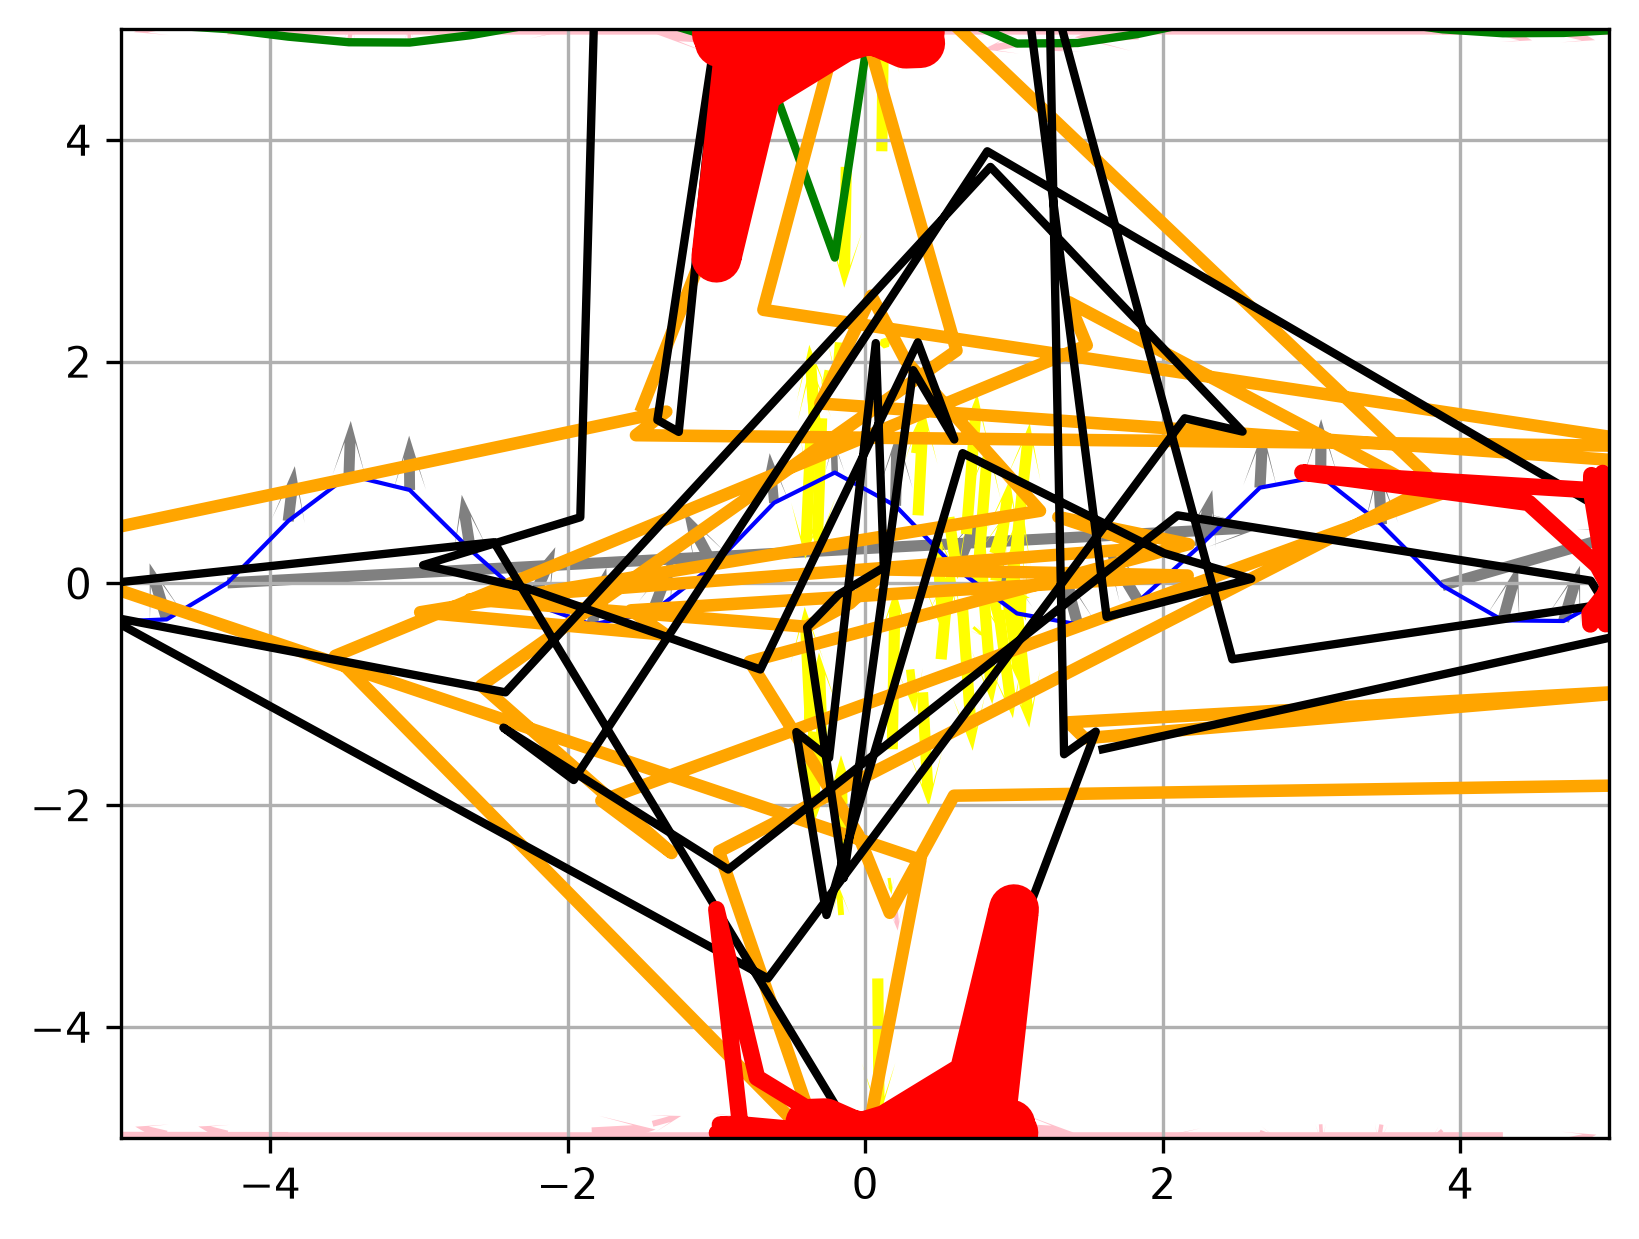
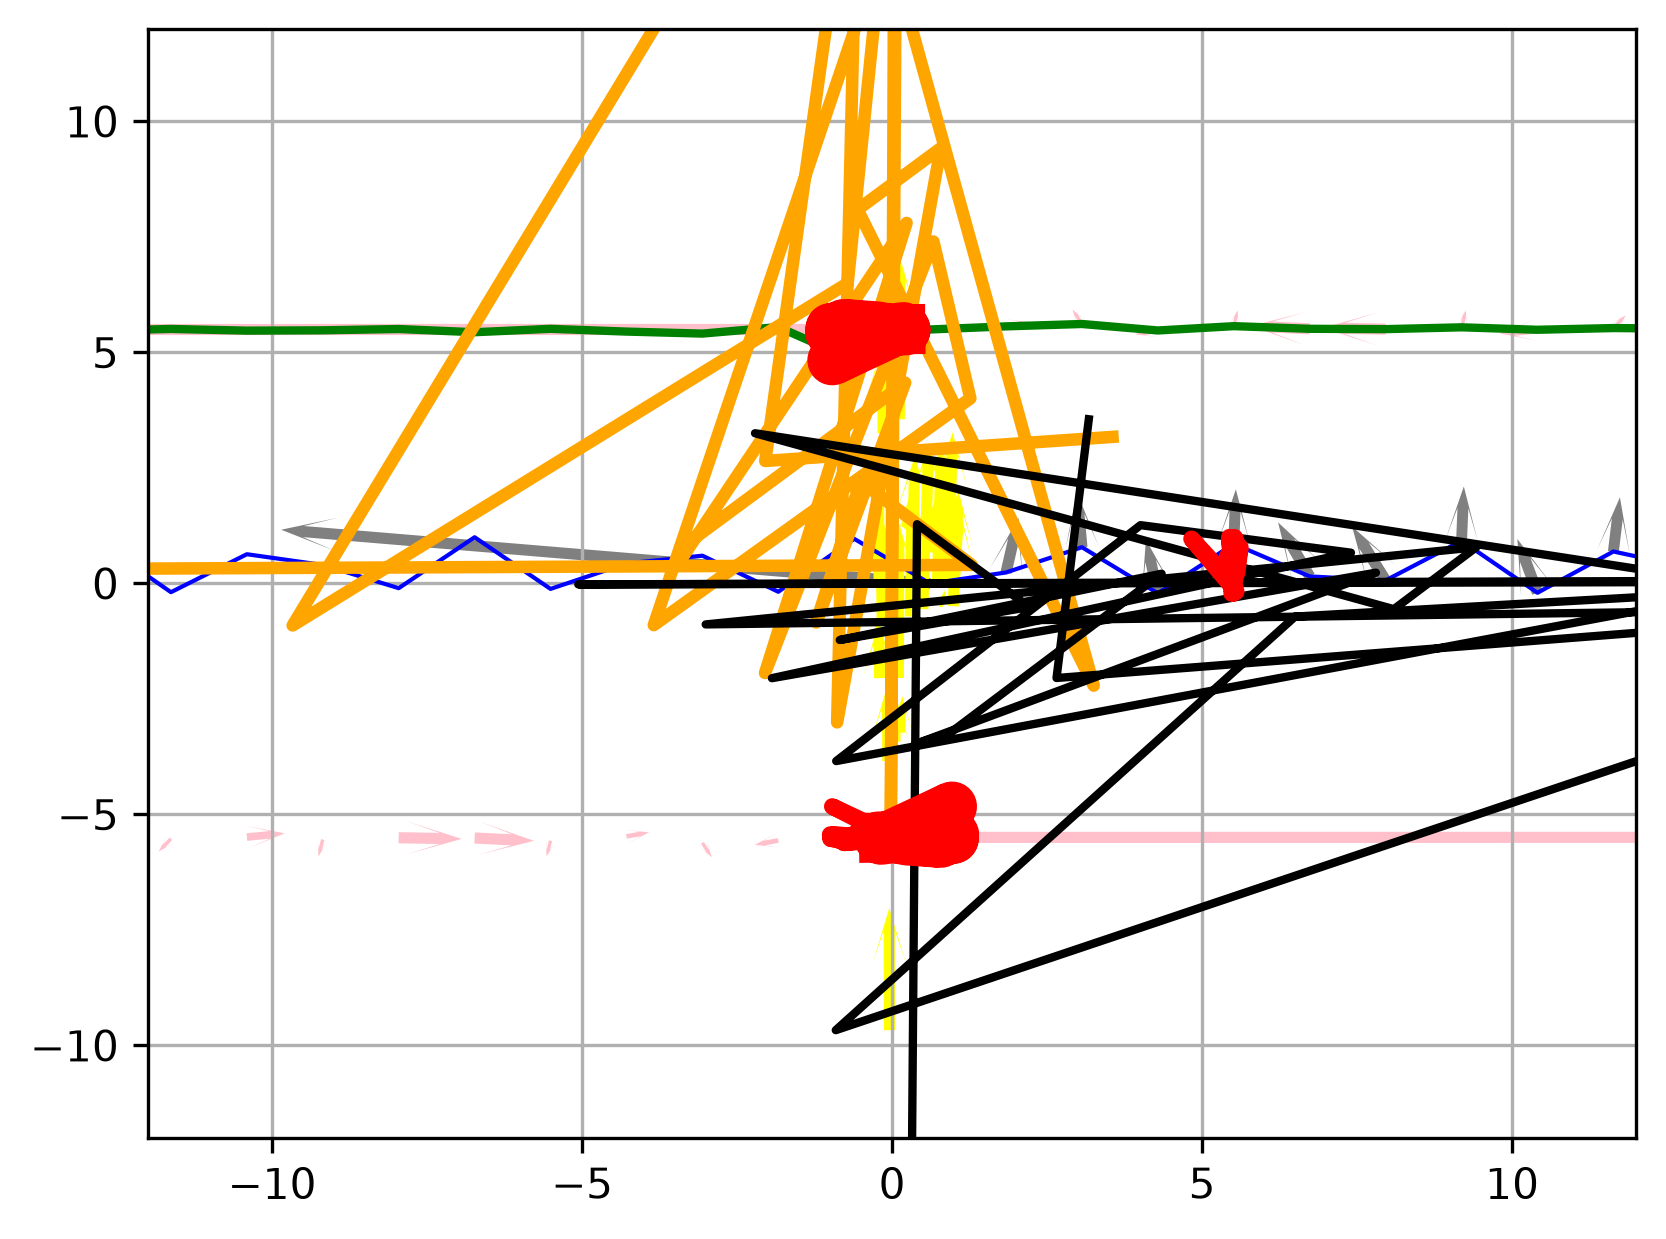
Code
import numpy as np
import matplotlib.pyplot as plt

def NoiseyChaoticForms(pos,span,chaos,file):

    #graphing waves
    x = np.linspace(-span, span, 50)

    #different combos
    y = np.cos(np.sin(x) - np.cos(x + chaos))
    u = (1/2) /x * np.sin(y) + (chaos + 3)
    v = np.cos((1/chaos)) * y * x
    t = (1/2) * (np.sin(x**(chaos-1)) / y)

    #plotting various wave forms
    plt.plot(x, y, color='blue', linewidth=1)
    plt.plot(x, u, color='green', linewidth=2)
    plt.plot(t, v, color='orange', linewidth=3)
    plt.plot(v, t, color='black', linewidth=2)
    plt.plot(u, y, color='red', linewidth=4)

    #plotting vector
    plt.quiver(x, y, t,u, color='grey',headwidth = 3,headaxislength = 2)
    plt.quiver(x, u, t,y, color='pink',headwidth = 3,headaxislength = 2)
    plt.quiver(y, t, y,x, color='yellow',headwidth = 3,headaxislength = 2)


    plt.grid(True)

    plt.xlim(-pos, pos)
    plt.ylim(-pos, pos)

    plt.savefig(file, dpi=300, bbox_inches="tight")

    np.savetxt("coordinates.csv", np.column_stack((x, y)), delimiter=",", header="x,y", comments="")

    plt.show()


NoiseyChaoticForms(5,10,2,"NoiseyForm1.png")
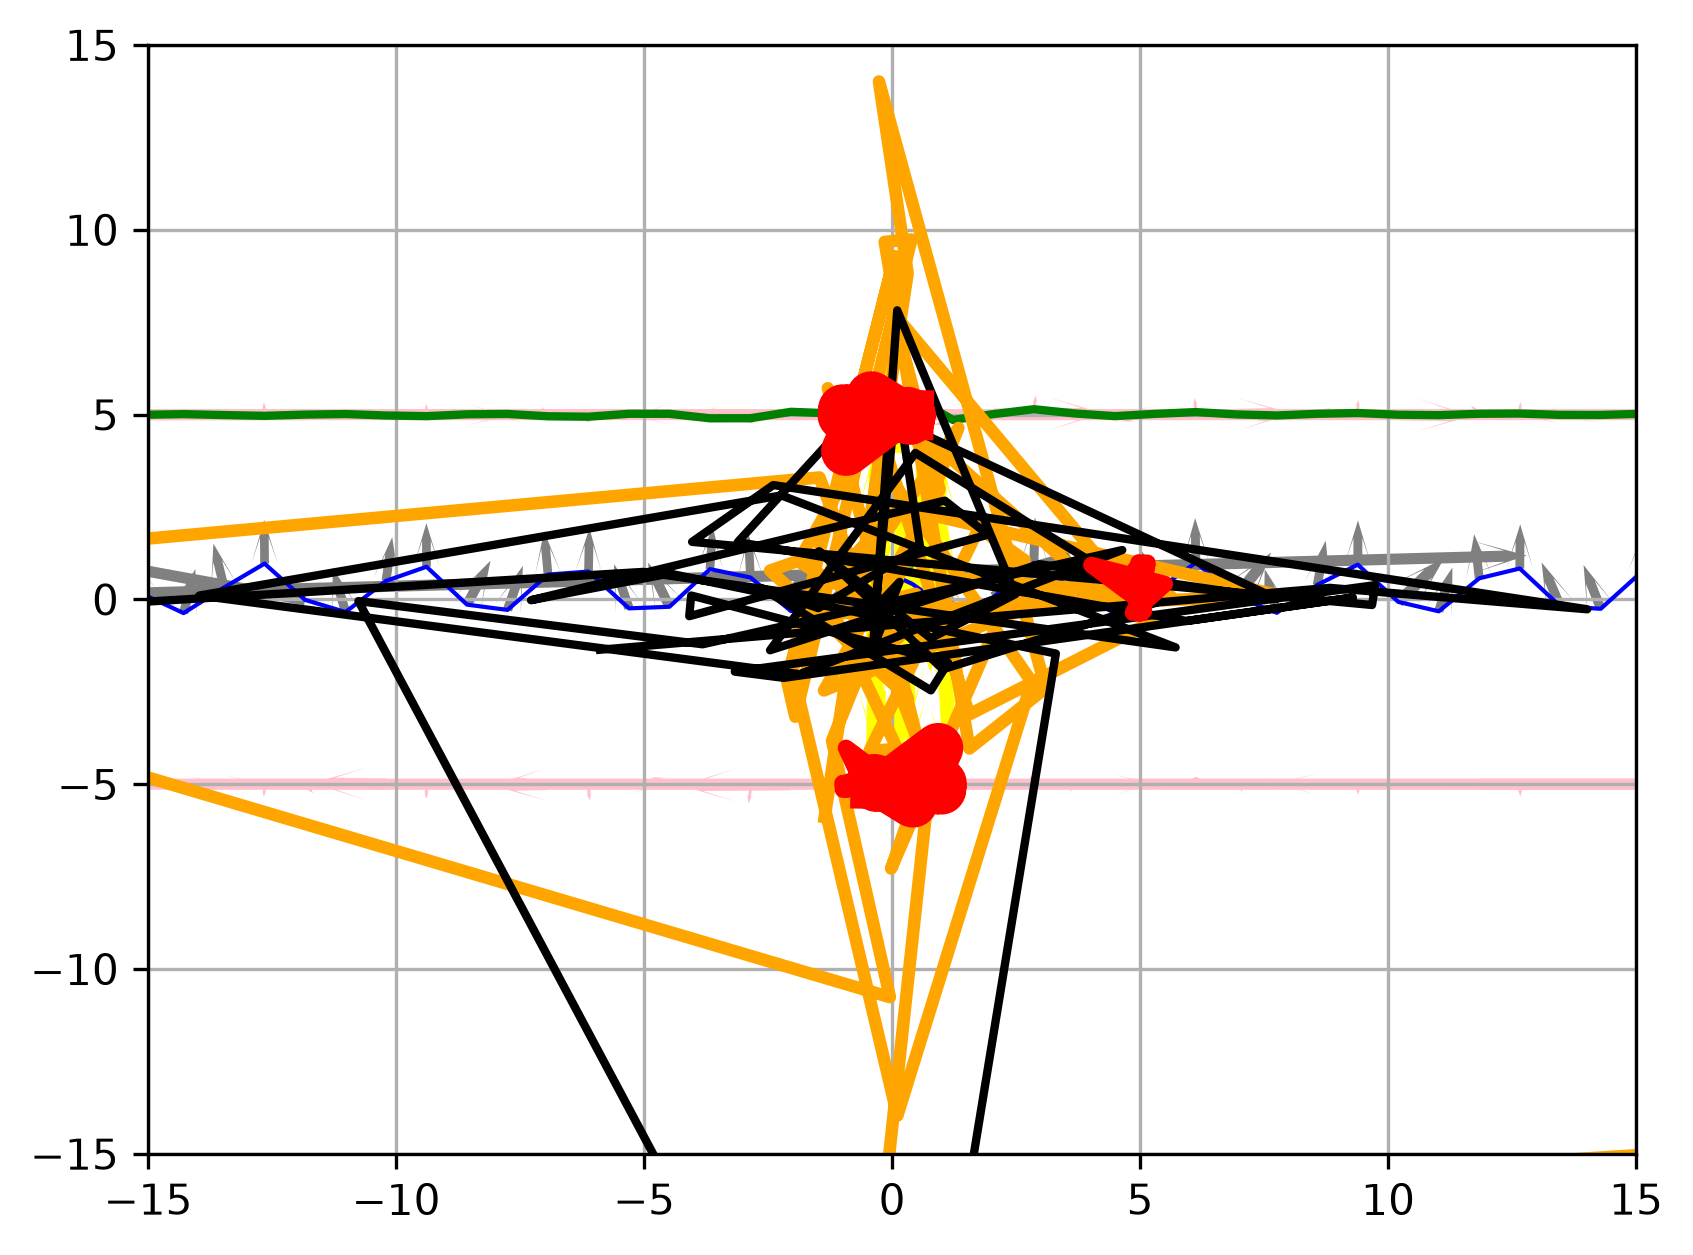
NoiseyChaoticForms(15,20,2,"NoiseyForm2.png")
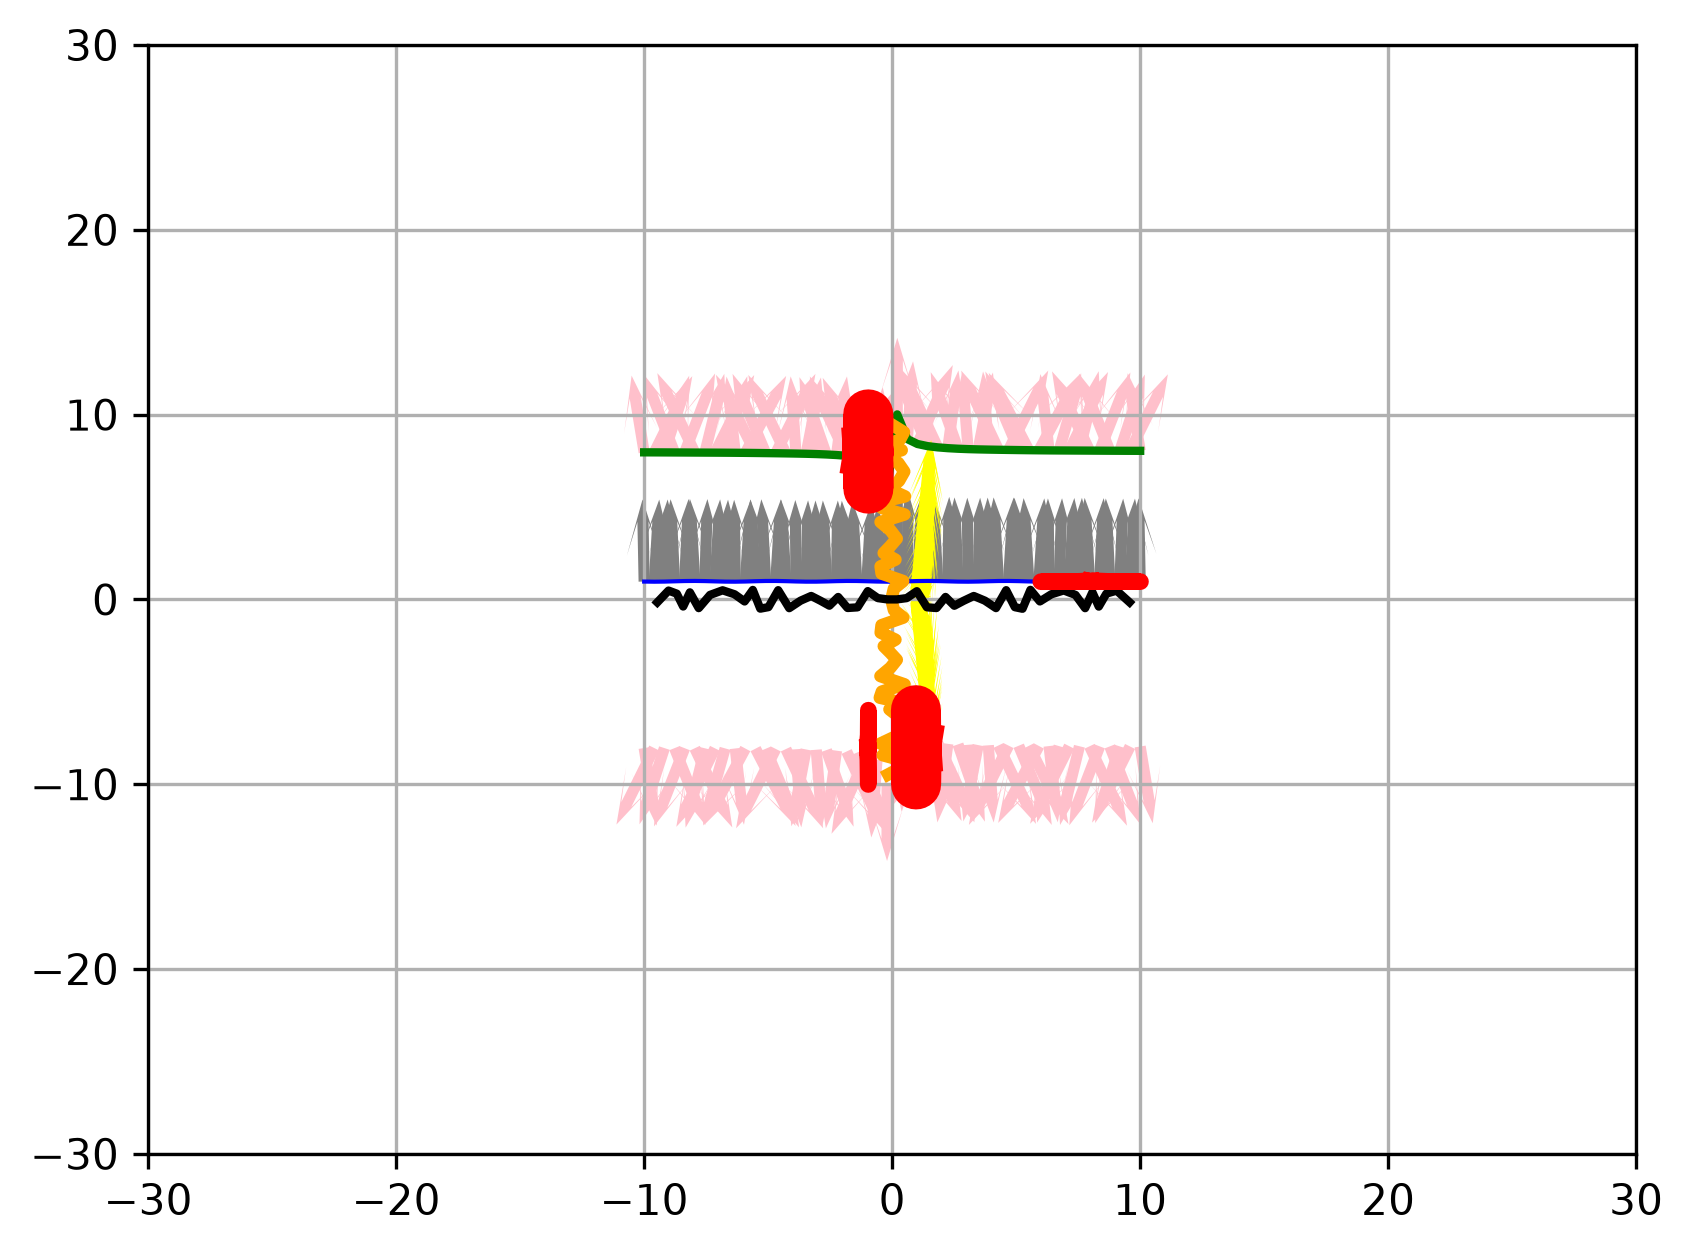
NoiseyChaoticForms(12,30,2.5,"NoiseyForm3.png")
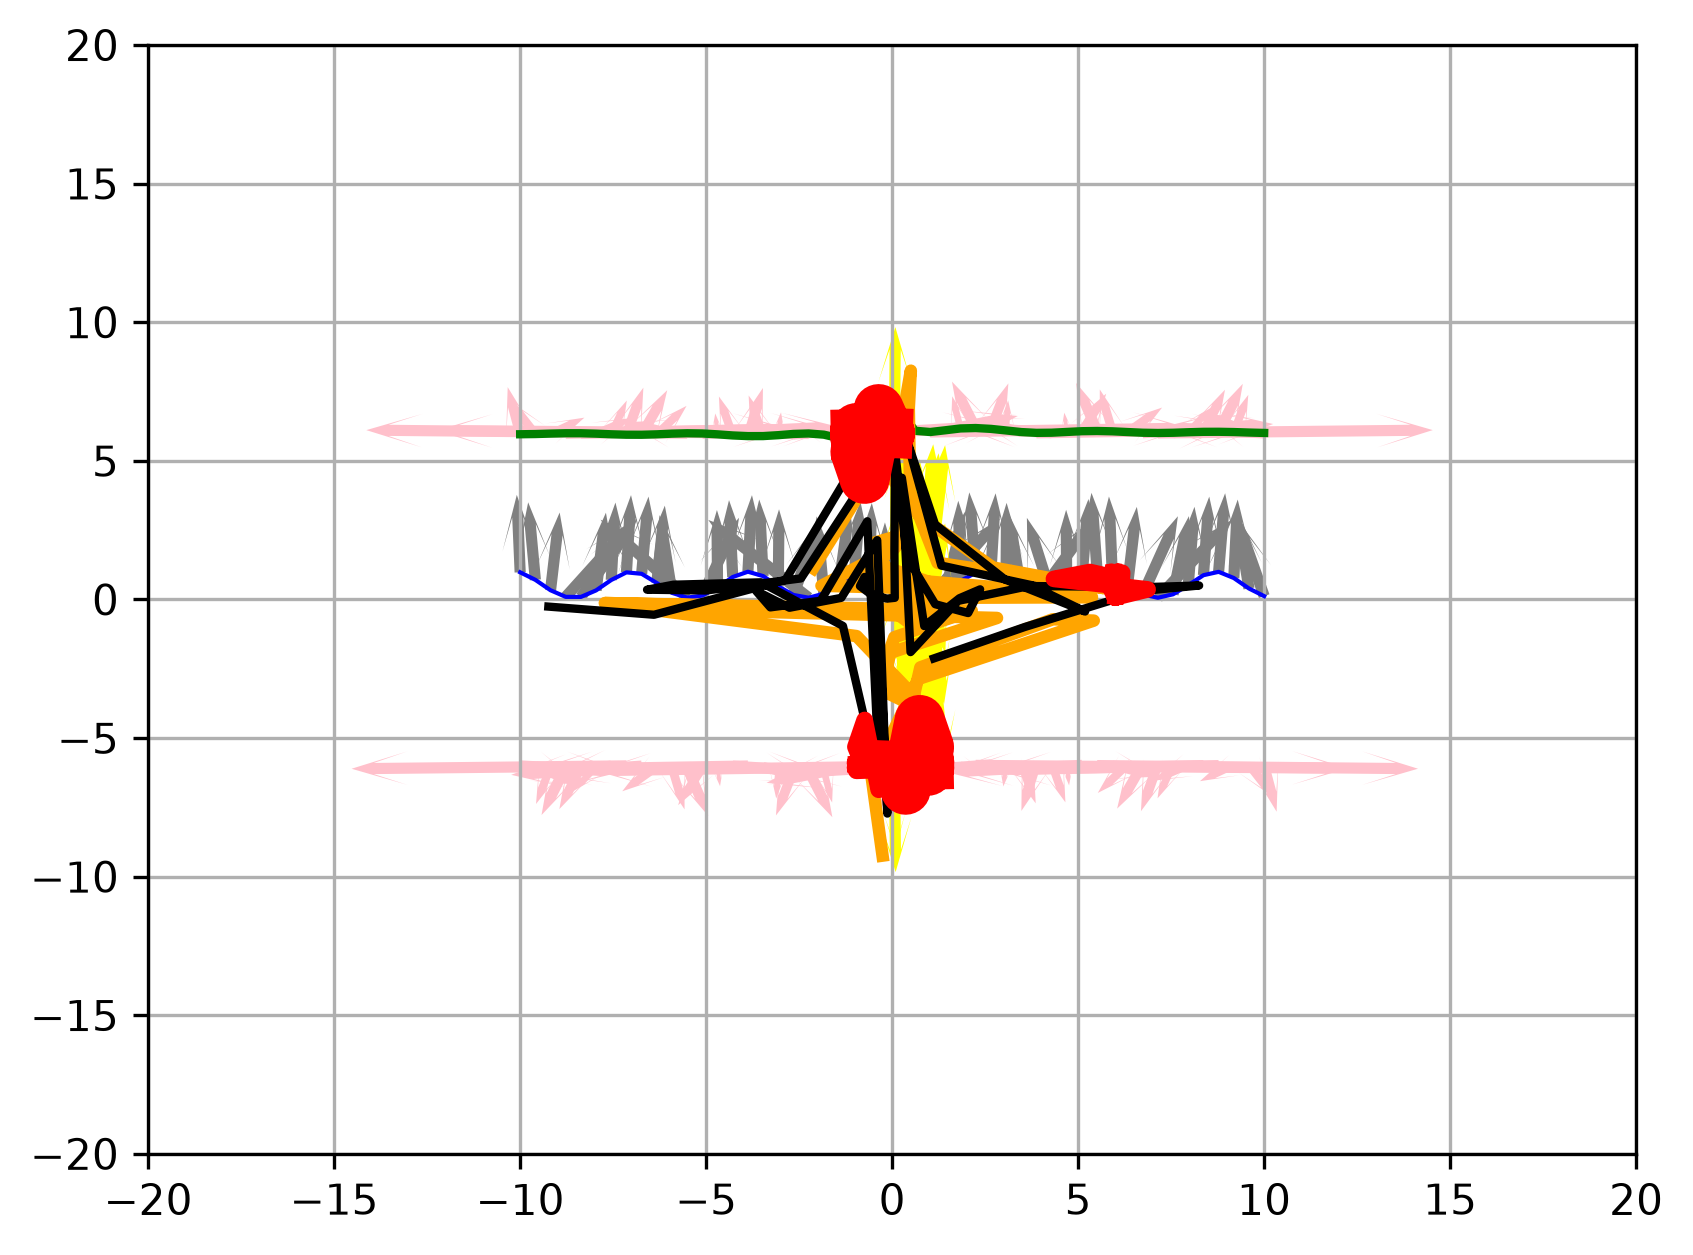
NoiseyChaoticForms(20,10,3,"NoiseyForm4.png")
NoiseyChaoticForms(30,10,5,"NoiseyForm5.png")
Comments
Join the discussionNo comments yet. Be the first to comment.