Command Palette
Search for a command to run...
Comments
Join the discussionNo comments yet. Be the first to comment.
More from this blog
WCCC_Tunnels
Tunnels Can Lead to A Place
Jul 30, 20261 min read
GameDev_MicroFiction
What Tales will be sought?
Jul 29, 20261 min read
WCCC_Spheres
Converging Entities
Jul 19, 20262 min read
WCCC_Drone
Slowly Drifting
Jul 12, 20262 min read

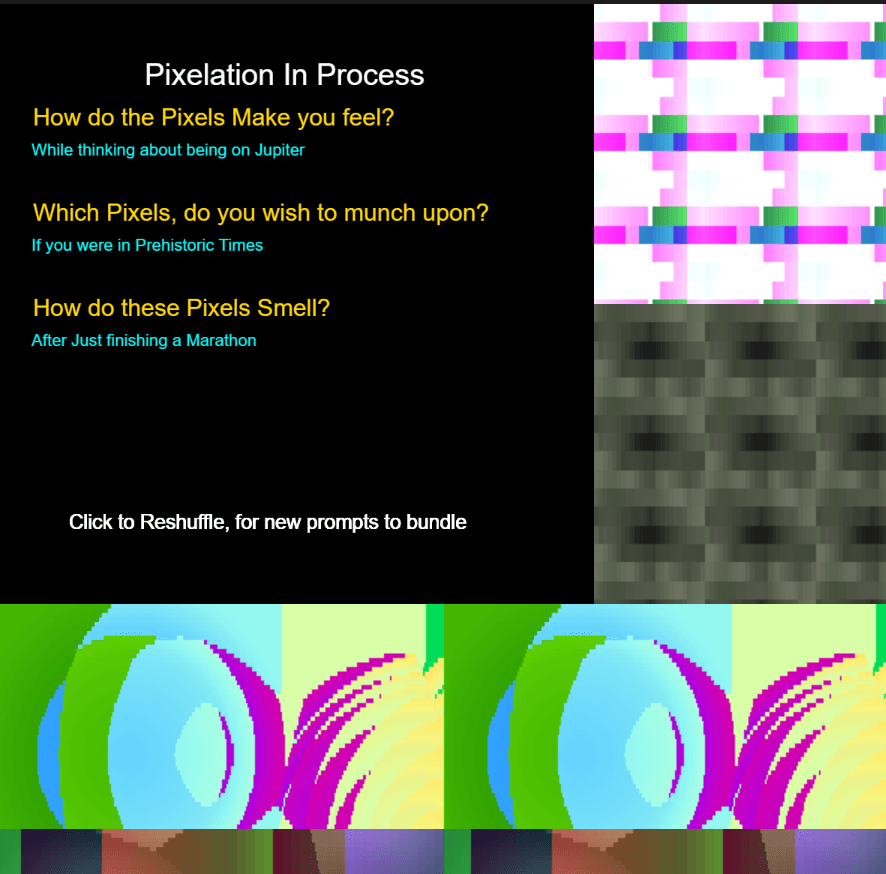
GameDev_PixelsPixelsPixels
Making Experiences through HydraVideoSynth & P5
Jul 9, 20261 min read