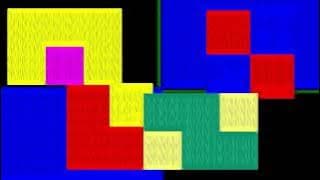
GridDownSize
GridDownSize is coded in Python with Grids that are recursively plotted [Prompt 26 of Genuary2026]
Poetry
Grids Recursively Created
Each plot, a presence of the past
An element that isn’t moving too fast
As a reminisce of the grid that it is related
To maintain the legacy of class
Video
Code
Python
import numpy as np
import matplotlib.pyplot as plt


def grid(d):

    colorpalettes = ['spring', 'summer', 'autumn', 'winter', 'cool',
                      'Wistia', 'hot', 'afmhot', 'gist_heat']

    C = np.random.randint(low=0, high=d, size=(d, d))

    plt.imshow(C, cmap= colorpalettes[d])
    plt.axis('off') # Hide all axes
    plt.show()

    if d == 0 or d == 1:
        return 1
    else:
        return grid(d - 1)

grid(7)
import numpy as np
import matplotlib.pyplot as plt


def grid(d):
    C = np.random.randint(low=0, high=d, size=(d, d))

    plt.imshow(C, cmap='bwr_r')
    plt.axis('off') # Hide all axes
    plt.show()

    if d == 0 or d == 1:
        return 1
    else:
        return grid(d - 1)

grid(7)
import numpy as np
import matplotlib.pyplot as plt
import random as rd


def grid(d):

    colorpalettes = ['spring', 'summer', 'autumn', 'winter', 'cool',
                      'Wistia', 'hot', 'afmhot', 'gist_heat']

    rd.shuffle(colorpalettes)

    C = np.random.randint(low=0, high=d, size=(d, d+1))

    plt.imshow(C, cmap= colorpalettes[d])
    plt.axis('off') # Hide all axes
    plt.show()

    if d == 0 or d == 1:
        return 1
    else:
        return grid(d - 1)

grid(7)
import numpy as np
import matplotlib.pyplot as plt
import random as rd


def grid(d):

    colorpalettes = ['spring', 'summer', 'autumn', 'winter', 'cool']
    colorpalettes2 = ['Wistia', 'hot', 'afmhot', 'gist_heat']

    rd.shuffle(colorpalettes)
    rd.shuffle(colorpalettes2)

    palettes = []
    palettes.append(colorpalettes[1:5]+ colorpalettes2[1:5])


    #print(palettes)

    rd.shuffle(palettes)

    C = np.random.randint(low=0, high=d, size=(d, d+1))

    plt.imshow(C, cmap= palettes[0][d-1])
    plt.axis('off') # Hide all axes
    plt.show()

    if d == 0 or d == 1:
        return 1
    else:
        return grid(d - 1)

grid(7)
grid(7)